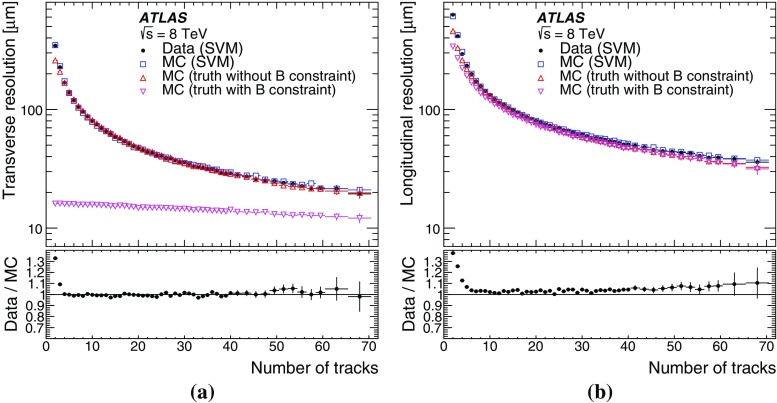
Fig. 13.
Resolution of the primary vertex position in a x and b z as function of the number of fitted tracks, estimated using the split-vertex method (SVM) for minimum-bias data (black circles) and MC simulation (blue squares). Also shown is the resolution obtained from the difference between the generator-level information and reconstructed primary vertex position in MC simulation (labeled “truth”), with and without the beam-spot constraint (pink and red triangles respectively). The bottom panel in each plot shows the ratio of the resolution found using the split-vertex method in data to that obtained using the MC generator-level information without the beam-spot constraint

