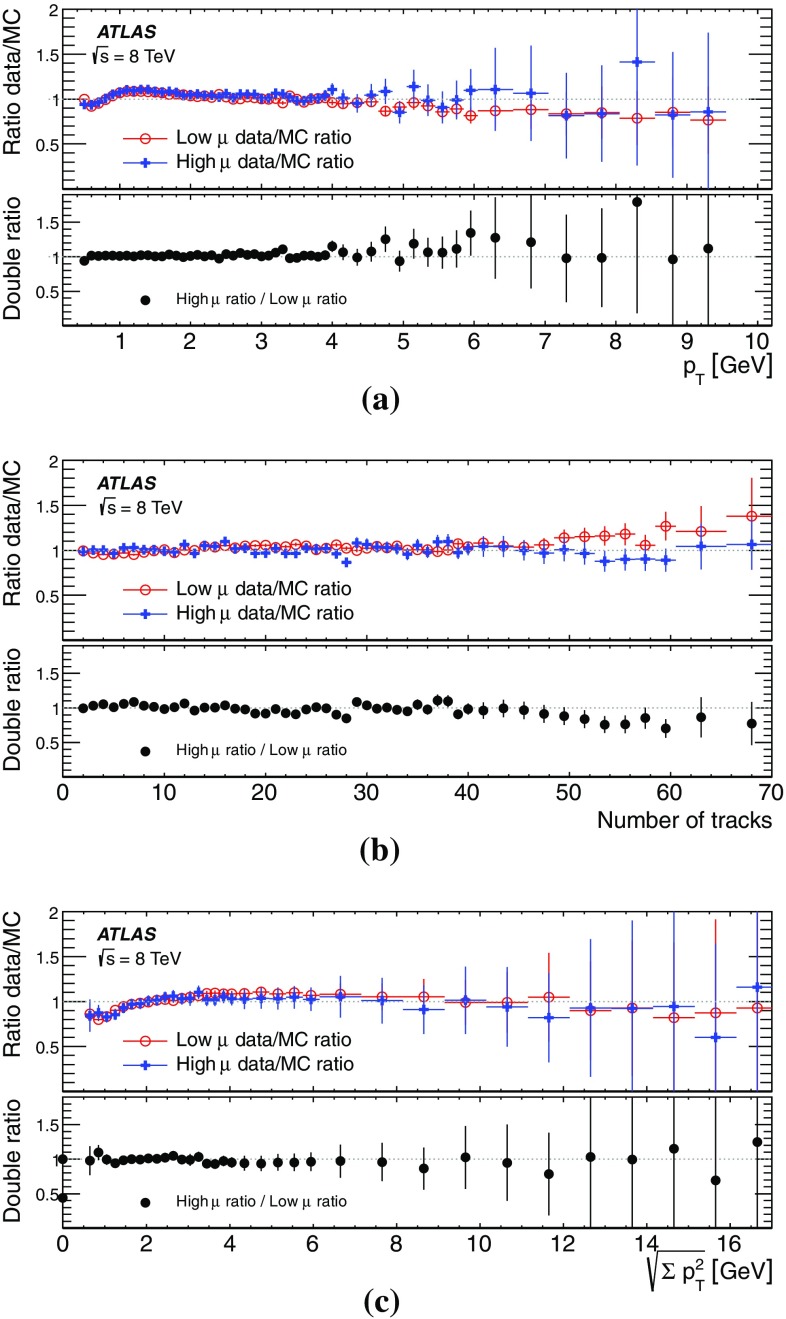
Fig. 15.
Ratios of data to MC simulation for observables relevant to the primary vertex reconstruction performance: a track transverse momentum , b number of tracks per vertex, c of the tracks in each vertex. Error bars represent only statistical uncertainties. The ratios are shown for low (0–1) and high (55–72) values of . The bottom panel in each figure shows the double ratio of high to low

