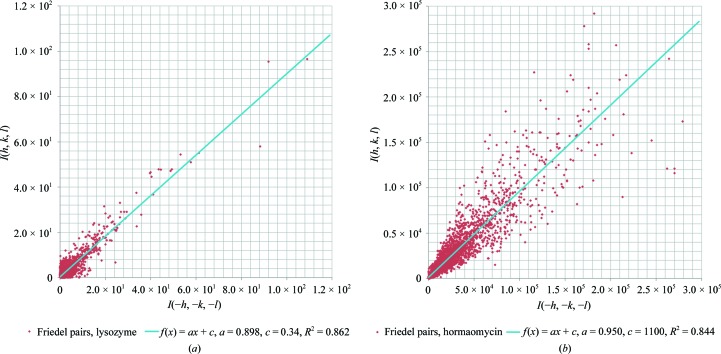
Figure 4.
Differences in intensities of Friedel pairs after scaling plotted for (a) a single lysozyme crystal used for structure solution with R Friedel = 0.329 and (b) X-ray data for hormaomycin, a macrocyclic depsipeptide in space group P1 with R Friedel = 0.151 (Gruene et al., 2014 ▸).

