
Figure 2.
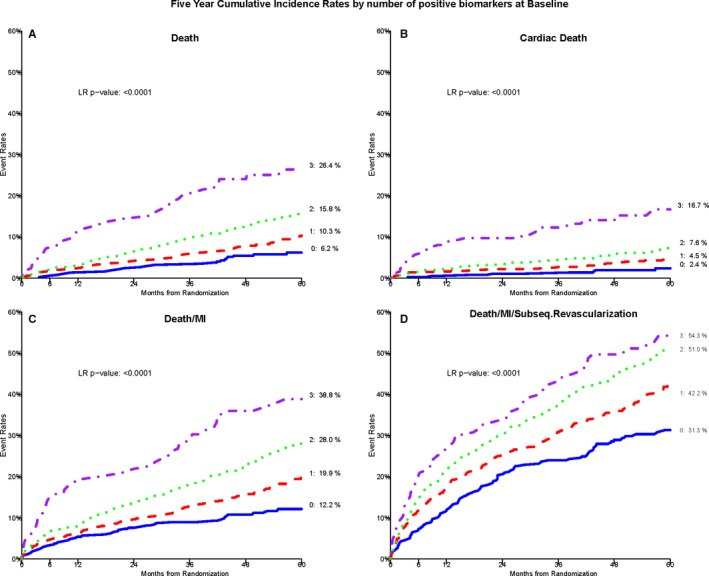
Kaplan–Meier cumulative incidence curves by BRS score. A through D, Demonstrate this association with all‐cause death, cardiac death, composite death/MI, and death/MI/revascularization, respectively, in those with BRS of 0, 1, 2, and 3. BRS, biomarker risk score; LR, likelihood ratio; MI, myocardial infarction; Subseq., subsequent.