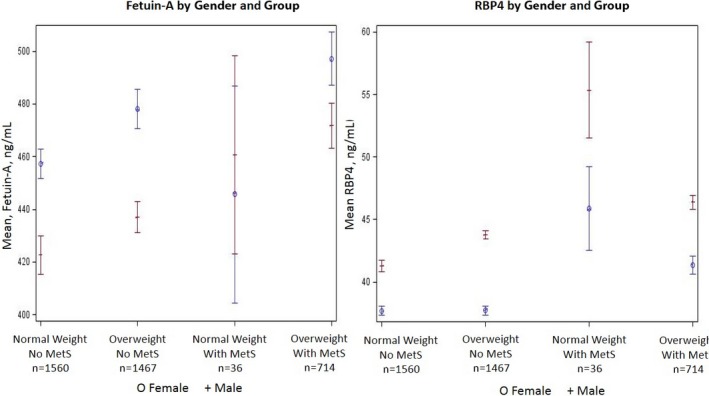
Figure 2.

Least square mean and standard error of plasma fetuin and retinol‐binding protein 4 (RBP4). The x axis represents different subgroups (presence/absence of metabolic syndrome [MetS] and normal/overweight). The y axis represents least square mean for fetuin and RBP4.
