Figure 3.

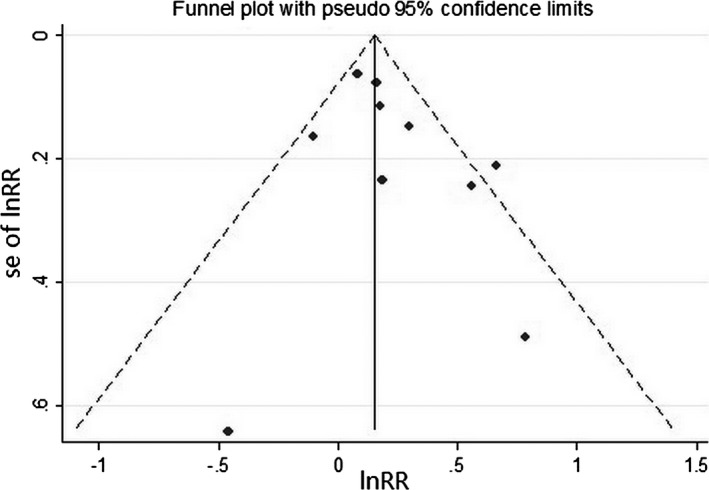
Funnel plots for bias assessment. Each point indicates an individual study. Funnel plots did not show obvious asymmetry. lnRR indicates natural logarithm of relative risk; se of lnRR, standard error of natural logarithm of relative risk.

Funnel plots for bias assessment. Each point indicates an individual study. Funnel plots did not show obvious asymmetry. lnRR indicates natural logarithm of relative risk; se of lnRR, standard error of natural logarithm of relative risk.