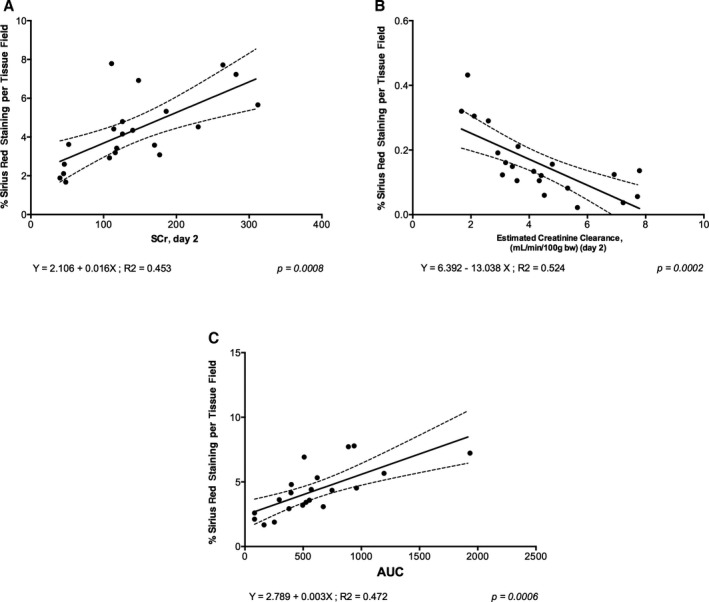
Figure 5.

Correlation data to show (A) serum creatinine (SCr) at day 2 vs Sirius red percentage per tissue field (indicative of fibrosis) at day 28, (B) the estimated creatinine clearance at day 2 vs Sirius red percentage per tissue field (indicative of fibrosis) at day 28, and (C) area under the curve (AUC) of SCr concentration (from day 1 to day 28) vs Sirius red percentage per tissue field (indicative of fibrosis) at day 28. All animal data (sham+vehicle, ischemia reperfusion injury [IRI]+vehicle, and IRI+IKK16 24 hours postreperfusion) are included in these graphs. AUC was calculated after plotting the values of SCr at day 1, 2, 7, 14, 21, and 28 postreperfusion. Linear regressions were calculated by the least squares method and their significance were estimated by Fisher F test. P<0.05 was considered to be significant.
