
Figure 2.
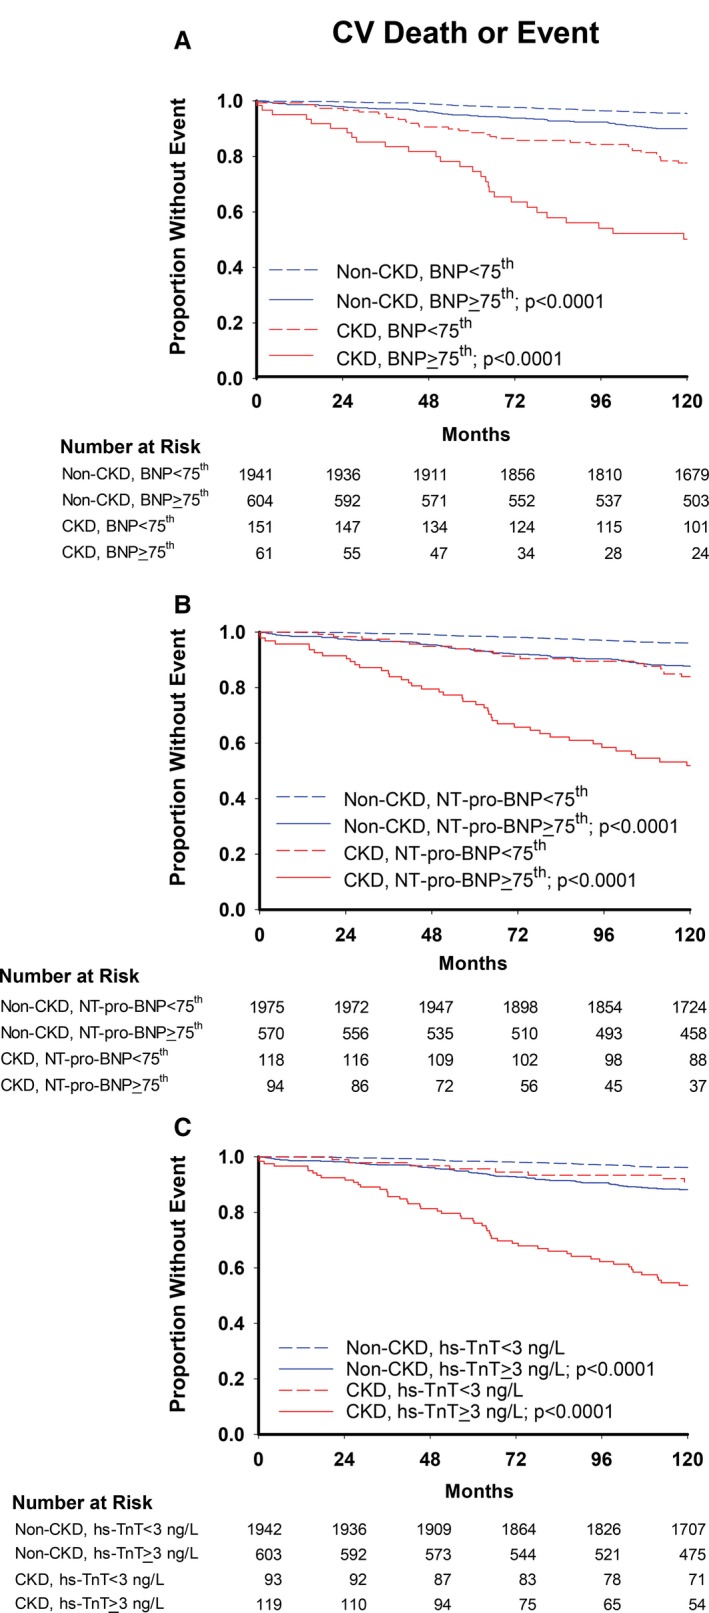
Kaplan–Meier curves for cardiovascular deaths or events with (A) BNP, (B) NT‐pro‐BNP, and (C) hs‐TnT cutoffs. P values are for log‐rank tests comparing curves within CKD and non‐CKD groups. BNP indicates brain natriuretic peptide; CKD, chronic kidney disease; hs‐TnT, high‐sensitivity troponin T; NT‐pro‐BNP, N‐terminal‐pro‐brain natriuretic peptide.