
Figure 3.
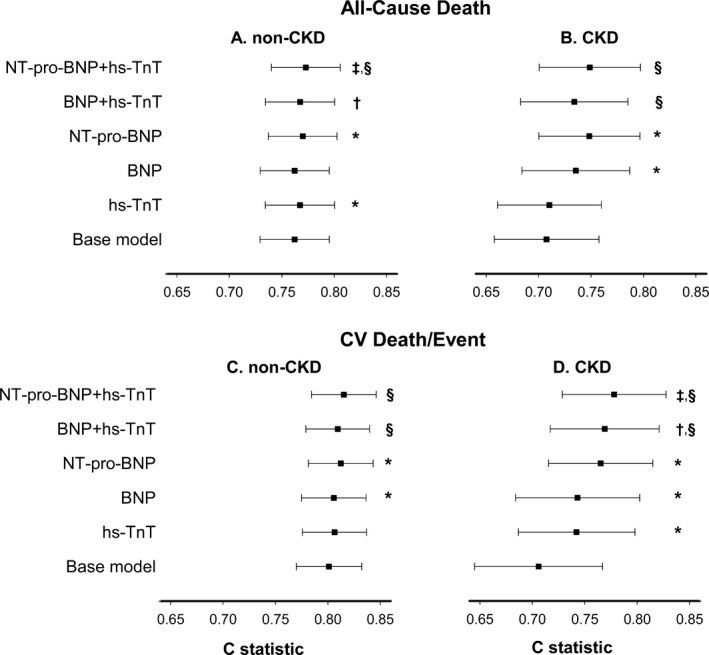
Differential prognostication of circulating biomarkers for all‐cause death in (A) non‐CKD and (B) CKD individuals; and for cardiovascular death or event in (C) non‐CKD and (D) CKD individuals. X‐axis represents Harrell's c‐statistics, and P values are for likelihood ratio tests comparing the nested models. BNP indicates brain natriuretic peptide; CKD, chronic kidney disease; hs‐TnT, high‐sensitivity troponin T; NT‐pro‐BNP, N‐terminal‐pro‐brain natriuretic peptide. *P<0.05 1 biomarker model compared with base model, including age, sex, race, diabetes mellitus, hypertension, smoking, and total and HDL cholesterol. † P<0.05 2 biomarker model compared to base model+BNP. ‡ P<0.05 2 biomarker model compared to base model+NT‐pro‐BNP. § P<0.05 2 biomarker model compared with base model+hs‐TnT.