Figure 1.

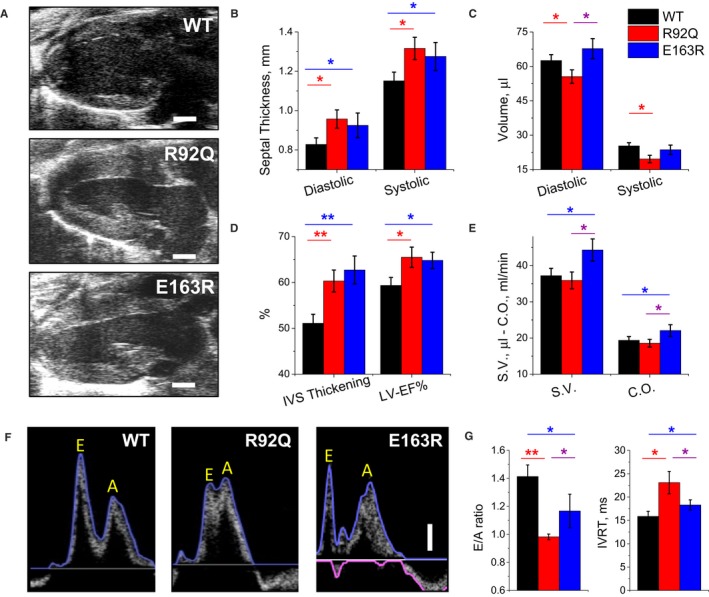
Echocardiographic measurements. A, Representative parasternal long‐axis views of the left ventricle at end diastole from wild‐type (WT), R92Q, and E163R mice. The horizontal scale bars equal 1 mm. B, Thickness of the interventricular septum (IVS) measured at end diastole (left) and at end systole (right) in WT, R92Q, and E163R mice. C, Left ventricular (LV) volumes are calculated using the Simpson technique at end diastole (left) and end systole (right) in mice from the 3 study groups. D, Systolic thickening of the IVS (left) and LV ejection fraction (LV‐EF%, right), are expressed as percentage of the diastolic values, measured in mice from the 3 cohorts. E, Stroke volume (SV) calculated from Simpson volumes and cardiac output (CO). F, Representative transmitral blood flow velocity curves recorded using pulsed‐wave Doppler echocardiography in apical views from WT, R92Q, and E163R mice. The vertical scale bar equals 100 mm/s. Early (passive, E) and late (atrial contraction, A) LV filling waves are indicated on the traces. G, Ratio between E and A waves (E/A ratio, left) and isovolumic LV relaxation time (IVRT, right) in mice from the 3 study cohorts. (B, E) Statistical tests: 1‐way ANOVA with Tukey correction. G, Statistical test: Welch's ANOVA with Games‐Howell test. (B through E and G) Means±SE from 10 mice per group. *=0.05>P>0.01; **=0.01>P>0.001.
