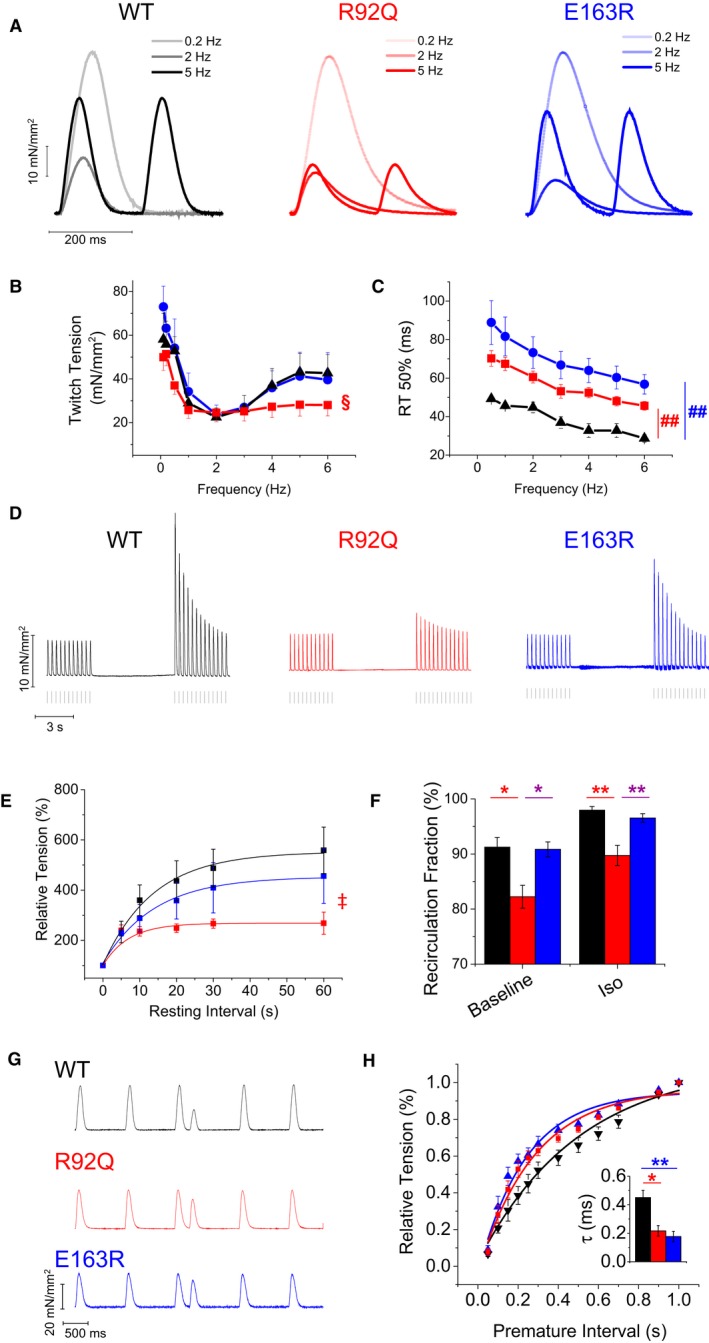
Figure 3.

Steady‐state and short‐term interval force relationships. A, Representative superimposed force traces from trabeculae of wild‐type (WT), R92Q, and E163R mice, stimulated at 0.2 Hz, 2 Hz, and 5 Hz. B, Relationship between active twitch force and stimulation frequency (0.1–6 Hz) in trabeculae from the 3 groups of mice. §=0.05>P>0.01 (R92Q vsWT) for frequencies 0.1 to 0.5 Hz and 4 Hz and 0.01>P>0.001 for 5 to 6 Hz. C, Time from peak to 50% relaxation (R50%, right), measured in steady‐state twitches at different stimulation frequencies. ##=0.01>P>0.001 at all frequencies. D, Representative force traces of post‐rest potentiation in trabeculae from WT, R92Q, and E163R mice; steady‐state stimulation 3 Hz, pause duration 10 seconds. E, Average percentage increase of twitch force after different pause intervals from a basal frequency of 3 Hz in the 3 study groups. ‡=0.05>P>0.01 at resting intervals of 20 to 60 seconds. F, Ca2+ recirculation fraction estimated by the decline of potentiated beats following a period of high stimulation rate in trabeculae from WT, R92Q, and E163R mice at baseline and in the presence of isoproterenol 10−7 mol/L (Iso). G, Mechanical restitution protocol: representative traces from WT, R92Q, and E163R trabeculae: steady‐state stimulation 1 Hz, premature interval 250 ms. H, Restitution curves show the fractional recovery of force (percent of 1 Hz steady‐state peak force) in response to the premature stimulus plotted against the premature interval. Each curve was fitted by a single exponential to obtain the time constant of mechanical restitution (τ): mean τ values are reported in the inset. (B, C through F, H) Mean±SE from 9 WT (6 mice), 11 R92Q (8 mice), and 9 E193R (6 mice) trabeculae, Statistical tests: linear mixed models with Tukey‐Kramer correction (corrected for heteroschedasticity in C and F). * =0.05>P>0.01; **=0.01>P>0.001.
