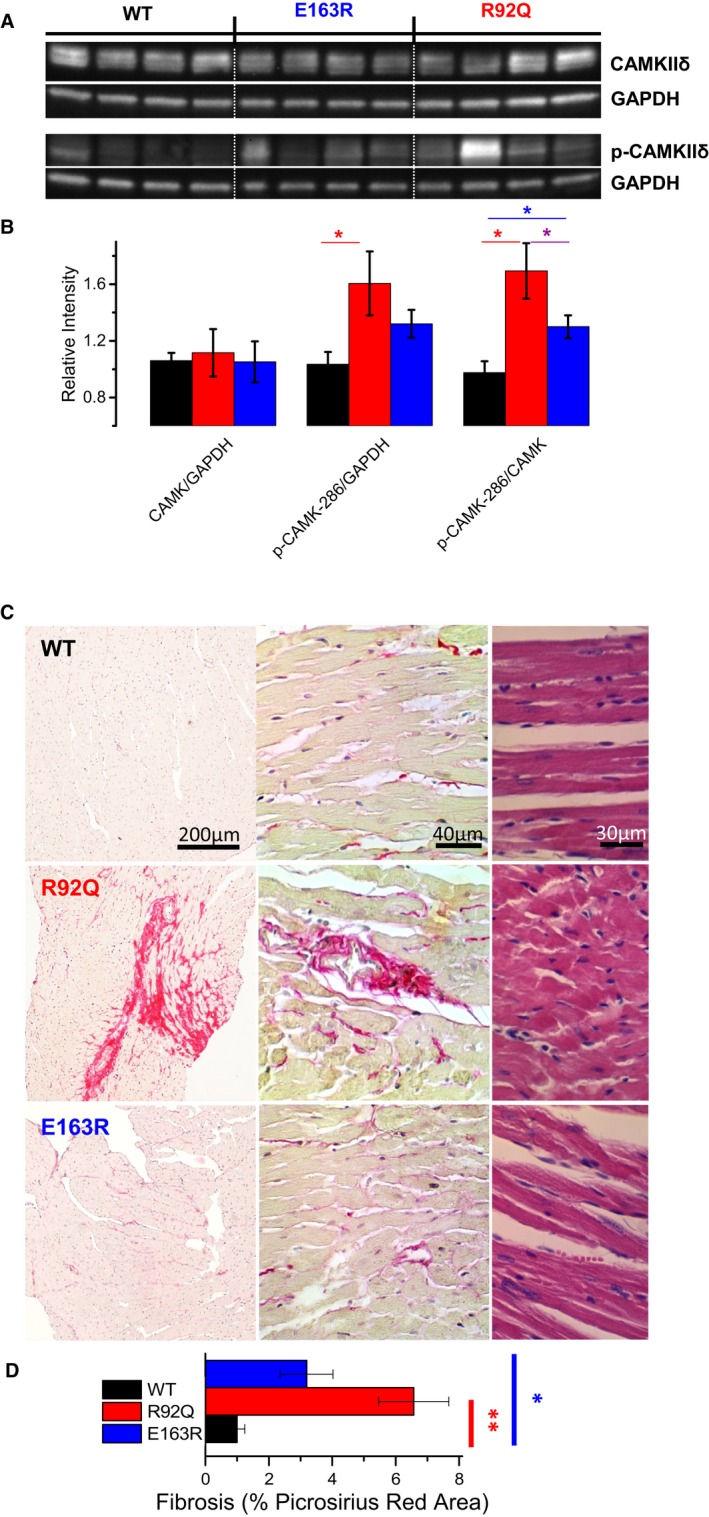
Figure 5.

Molecular investigation of calcium/calmodulin‐dependent protein kinase II (CaMKII) signaling and myocardial fibrosis. A, Representative Western blots for total CaMKII, phospho‐CaMKII at tyrosine 287, and GAPDH. B, Average values in wild‐type (WT), R92Q, and E163R hearts (7 samples for each groups). The intensity of individual bands was quantified and normalized to that of GAPDH. Relative intensities of WT were set at 1. Statistical test: 1‐way ANOVA with Tukey correction. *=0.05>P>0.01. C, Representative histological sections of mouse left ventricular myocardium from WT, R92Q, and E163R mice. The left and central images show sections stained with hematoxylin (purple, marking cell nuclei) and Picrosirius red (pink) at different magnification; the bright pink strands denote collagen fibers. Sections shown on the right are stained with hematoxylin and eosin. D, Fraction of the myocardium occupied by collagen fibers, expressed as percentage of the whole section's area, measured in samples from mice of the 3 groups. Mean±SE from 9 mice per group. Five histological sections of the same size from each mouse were analyzed to calculate the extent of Picrosirius red–positive areas. Statistics: Kruskal–Wallis test with Dunn's multiple comparisons test. *=0.05>P>0.01; **=0.01>P>0.001.
