Figure 6.

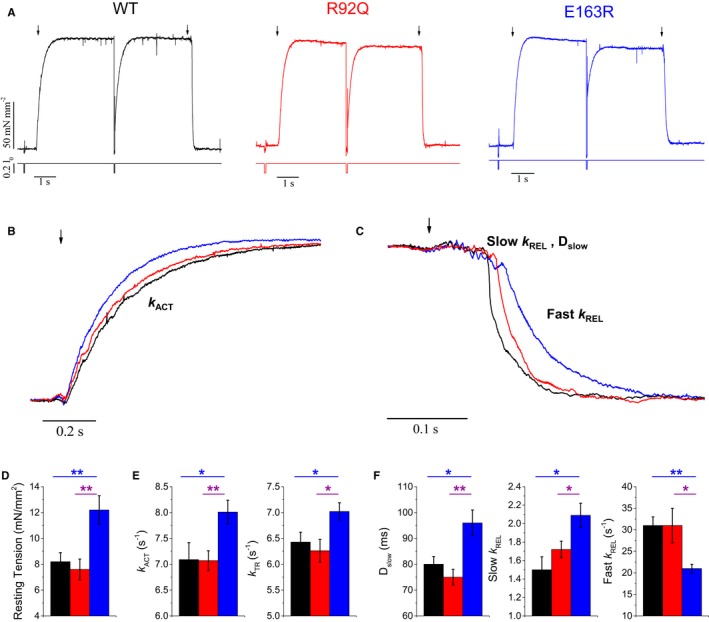
Mechanical measurements on single myofibrils. A, Tension generation and relaxation: representative tension responses of wild‐type (WT), E163R, and R92Q myofibrils, maximally activated (pCa 4.5) and fully relaxed (pCa 8) by fast solution switching technique at 15°C, [MgATP] 5 mmol/L; [Pi] <5 μmol/L. The timing of solution switch is indicated by black arrows. (B through C) Superimposed representative tension curves from single myofibrils isolated from WT, R92Q, and E163R hearts, highlighting the kinetics of force generation (B) and relaxation (C). Of note, relaxation is biphasic, with an initial linear phase (slow) followed by an exponential decay of force (fast phase). D, Resting tension in WT, R92Q, and E163R myofibrils. E, Kinetic parameters of tension generation in WT, R92Q, and E163R myofibrils: time constant of tension activation (k ACT, left) and of tension redevelopment upon myofibril relengthening after forced slacking (k TR, right). F, Kinetic parameters of myofibril relaxation: duration of the slow linear phase (Dslow, left) and time constant of the slow phase of relaxation (Slow k REL, center) and of the fast exponential phase (Fast k REL, right). (D through F) Mean±SE from 32 WT, 34 R92Q, and 36 E163R myofibrils, 3 mice per group. Statistical tests: linear mixed models with Tukey‐Kramer correction. *=0.05>P>0.01; **=0.01>P>0.001.
