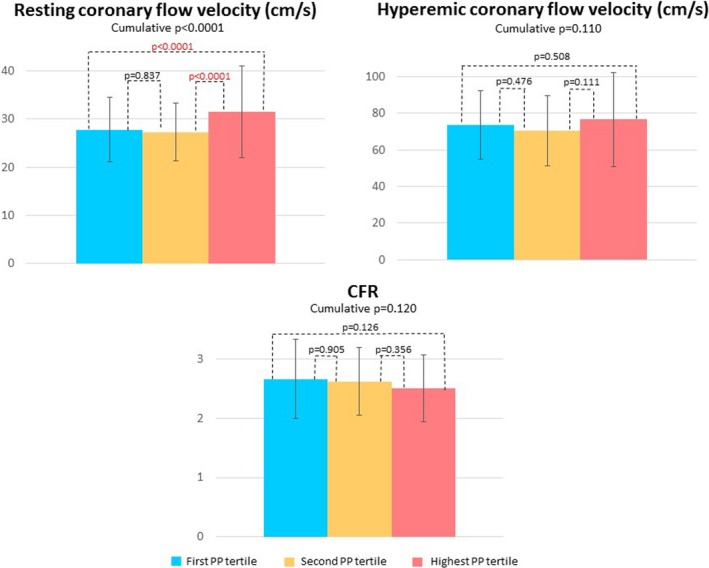
Figure 2.

Graphs showing coronary flow reserve (CFR) and resting and hyperemic coronary flow velocity trends according to subdivision in pulse pressure (PP) tertiles: the first PP tertile (PP ≤50 mm Hg), the second PP tertile (50< PP ≤60 mm Hg) and the highest PP tertile (PP >60 mm Hg). Data are presented as mean value with SD bars and P value.
