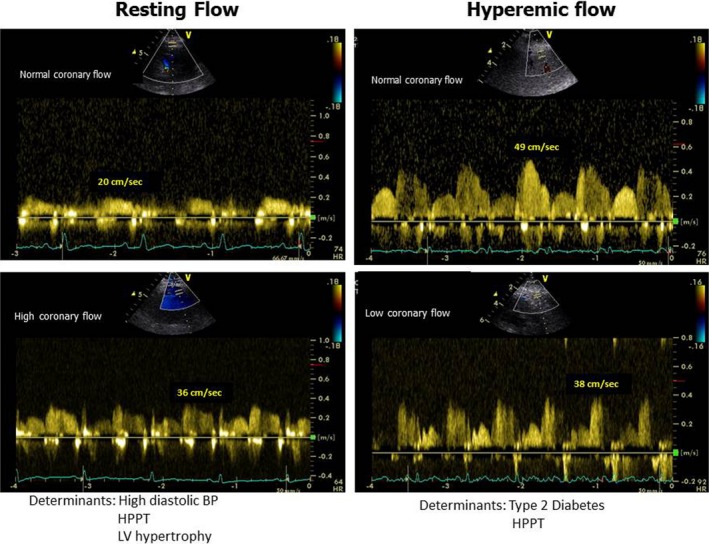
Figure 4.

Schema depicting the main determinants of coronary flow at rest and after dipyridamole‐induced hyperemia in 4 different patients without obstructive coronary artery disease. Left panel, normal (upper) and abnormally high coronary flow velocity at rest. Right panel, normal (upper) and abnormally low hyperemic coronary flow velocity. BP indicates blood pressure; HPPT, highest pulse pressure tertile; LV, left ventricular.
