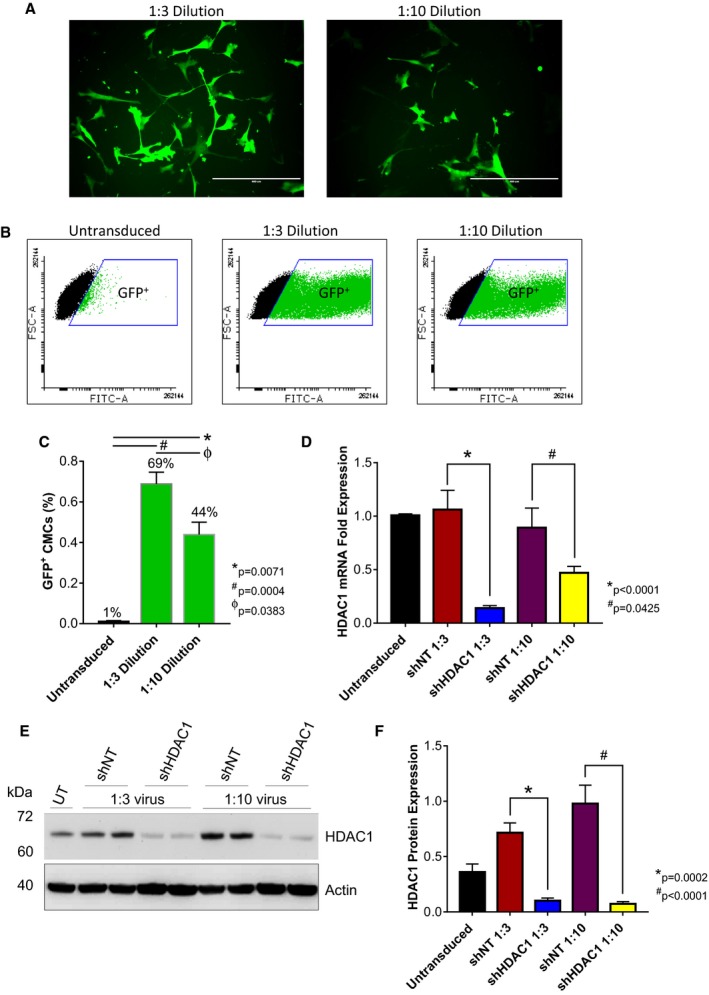
Figure 2.

shRNA‐mediated depletion of HDAC1 in human CMCs. Representative (A) epifluorescence microscopy images (n=3; scale=400 μm) and (B and C) flow cytometric analysis (values are mean±SEM; n=3) of CMCs 72 hours after transduction with the MISSION pLKO.1‐puro‐CMV‐TurboGFP Positive Control Vector (1:3 or 1:10 viral titer dilutions). Flow cytometry data were arcsine‐transformed and analyzed by unpaired, 1‐way ANOVA. P values were calculated using the post hoc Bonferroni multiple comparison test. The efficacy of HDAC1 knockdown in CMCs assessed by (D) qPCR (values are mean±SEM; n=4) and (E) Western blot (representative image; n=4). F, Bar graph denoting densitometric quantification of resulting HDAC1 immunoblots. Values represent mean protein expression (relative to β‐actin)±SEM (n=4). qPCR and Western blot data were log base 10 (y=log10 y) transformed and analyzed by unpaired, 1‐way ANOVA. P values were calculated using the post hoc Bonferroni multiple comparison test. CMCs indicates cardiac mesenchymal stromal cells; FSC‐A, forward scatter pulse area; GFP, green fluorescent protein; HDAC1, histone deacetylase 1; shHDAC1, short hairpin RNA‐histone deacetylase 1; shNT, short hairpin RNA nontarget; UT, untransduced.
