
Figure 2.
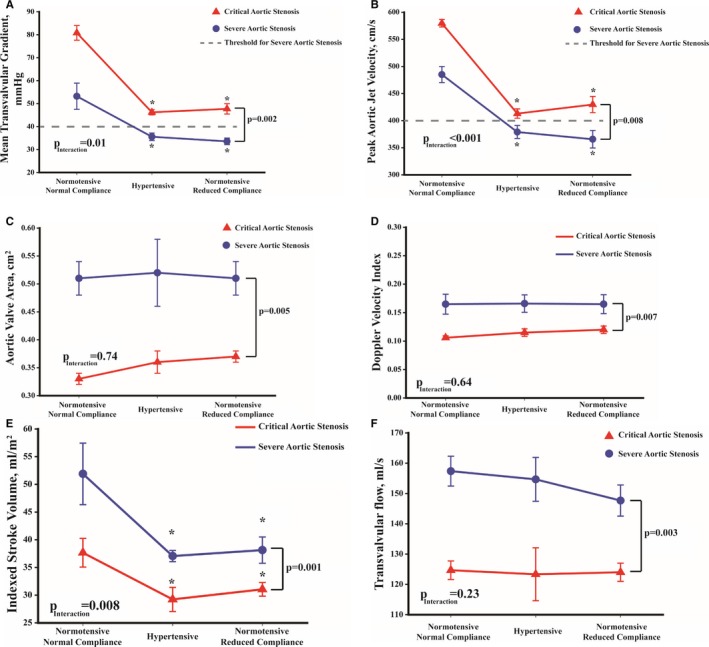
Evolution of hemodynamic variables of severe (blue line) and critical aortic stenosis (red line) in sheep with normal blood pressure, hypertension, and reduced systemic arterial compliance. (A) The evolution of mean transvalvular gradient, (B) peak aortic jet velocity, (C) aortic valve area, (D) Doppler velocity index, (E) stroke volume index, and (F) mean transvalvular flow rate. Note that in severe AS, peak aortic jet velocity and mean gradient are in the non‐severe range with concomitant hypertension or reduced systemic arterial compliance. P is P value of severe stenosis vs critical stenosis. P Interaction is the interaction between stage (ie, normotensive and normal compliance, hypertension or reduced systemic arterial compliance) and stenosis severity (ie, critical or severe). *P<0.05 compared with normotensive and normal compliance stage of the same stenosis severity group.