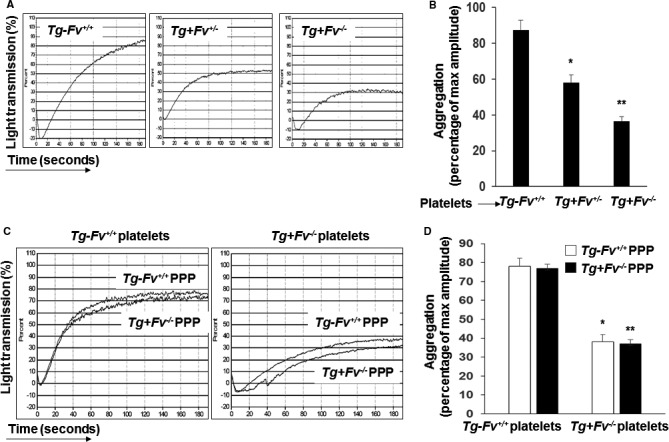
Figure 4.

Platelet factor V modulated platelet reactivity. Platelet aggregation in platelet‐rich plasma from mice of the indicated genotypes was induced by ADP and optically monitored. A, Representative aggregation curves are shown. B, The bar graph shows the aggregation results expressed as maximal amplitude of aggregation (n=6 per group; *P<0.05 vs the Tg‐Fv+/+ mice; **P<0.05 vs the Tg+Fv+/− or Tg‐Fv+/+ mice). C, Isolated platelets from either Tg‐Fv+/+ or Tg+Fv −/− mice, as described in Methods. Citrated, pooled, platelet‐poor plasma (PPP) from either Tg‐Fv+/+ or Tg+Fv −/− mice was isolated and combined with platelets of the indicated genotype. Aggregation was induced by ADP and optically monitored. Representative aggregation curves are shown. D, The bar graph shows the aggregation results expressed as maximal amplitude of aggregation (n=8 per group; *, **P<0.05 vs Tg‐Fv+/+ platelets).
