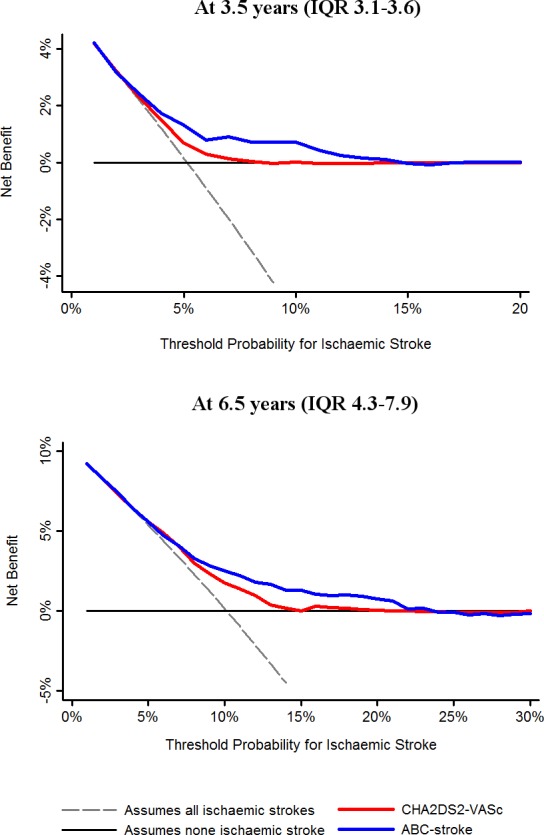
Figure 2.

Decision curves for the ABC‐stroke (age, biomarkers [N‐terminal fragment B‐type natriuretic peptide, high‐sensitivity troponin], and clinical history [prior stroke/transient ischemic attack]) and CHA 2 DS 2‐VASc (cardiac failure or dysfunction, hypertension, age ≥75 [doubled], diabetes mellitus, stroke [doubled]—vascular disease, age 65 to 74 years and sex category [female]) scores. This analysis shows the clinical usefulness of each score based on a continuum of potential thresholds for ischemic stroke (x axis) and the net benefit of using the model to stratify patients at risk (y axis) relative to assuming that no patient will have an ischemic stroke. IQR indicates interquartile range.
