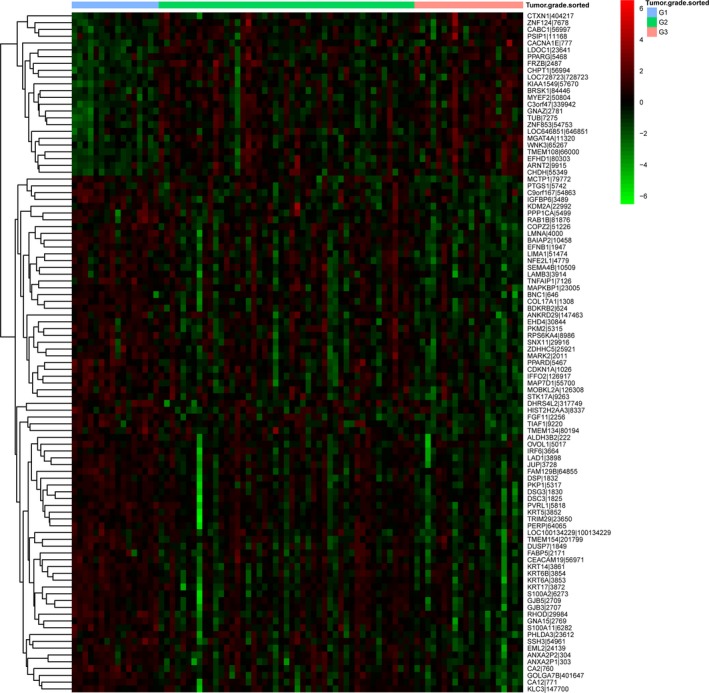
Figure 2.

Box‐plot depicted the median and interquartile range of expression levels of candidate genes associated with the tumor grade of ESCC in the G1, G2 and G3 groups. The candidate genes were LAD1, TIAF1, FGF11, CA12, GNA15, JUP, PKP1, PPARD, TMEM108 and C3orf47.
