
Figure 3.
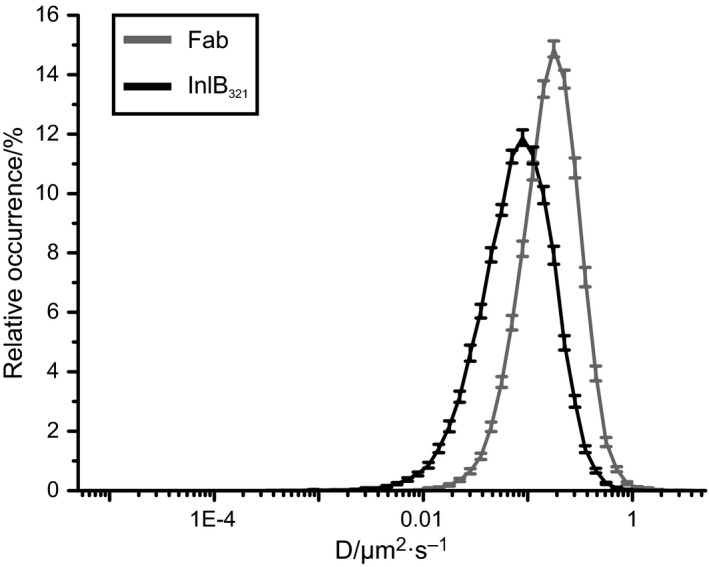
Relative occurrence of MET diffusion coefficients obtained by imFCS. A distribution of diffusion coefficients obtained by imFCS of InlB‐bound and resting MET at 23 °C was plotted (N = 60 cells). Distributions are shifted to higher diffusion coefficients compared to uPAINT data as imFCS does not recognize immobile particles. SEMs are depicted as error bars.