
Figure 3.
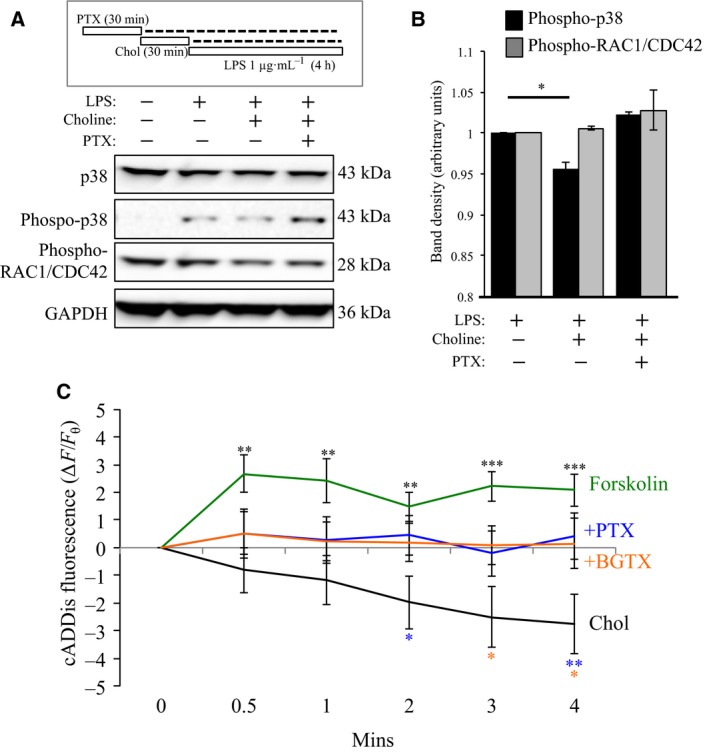
α7 nAChR/G protein interaction regulates p38 phosphorylation and cAMP levels. (A) Gantt chart of the experiment: Chol (1 mm); PTX (100 ng·mL−1); LPS (1 μg·mL−1). Western blot detection of total p38, phospho‐p38, and phospho‐RAC1/CDC42 expression in EOC20 cells. Anti‐GAPDH detection was used to confirm loading across lanes. (B) Average values of the band density for three separate experiments (n = 3) in (A) demonstrate a significant effect of choline on phospho‐p38 level. (C) cAMP detection in EOC20 cells using real‐time cADDis fluorescence measure. Cells were treated with 3 mm Chol (black) or 3 mm Chol following pretreatment with 100 ng·mL−1 PTX (blue); 50 nm BGTX (orange). Treatment with 10 μm forskolin (green) was used as a positive control in the cAMP assay. (***P < 0.001, **P < 0.01, *P < 0.05, n = 8+ per group)