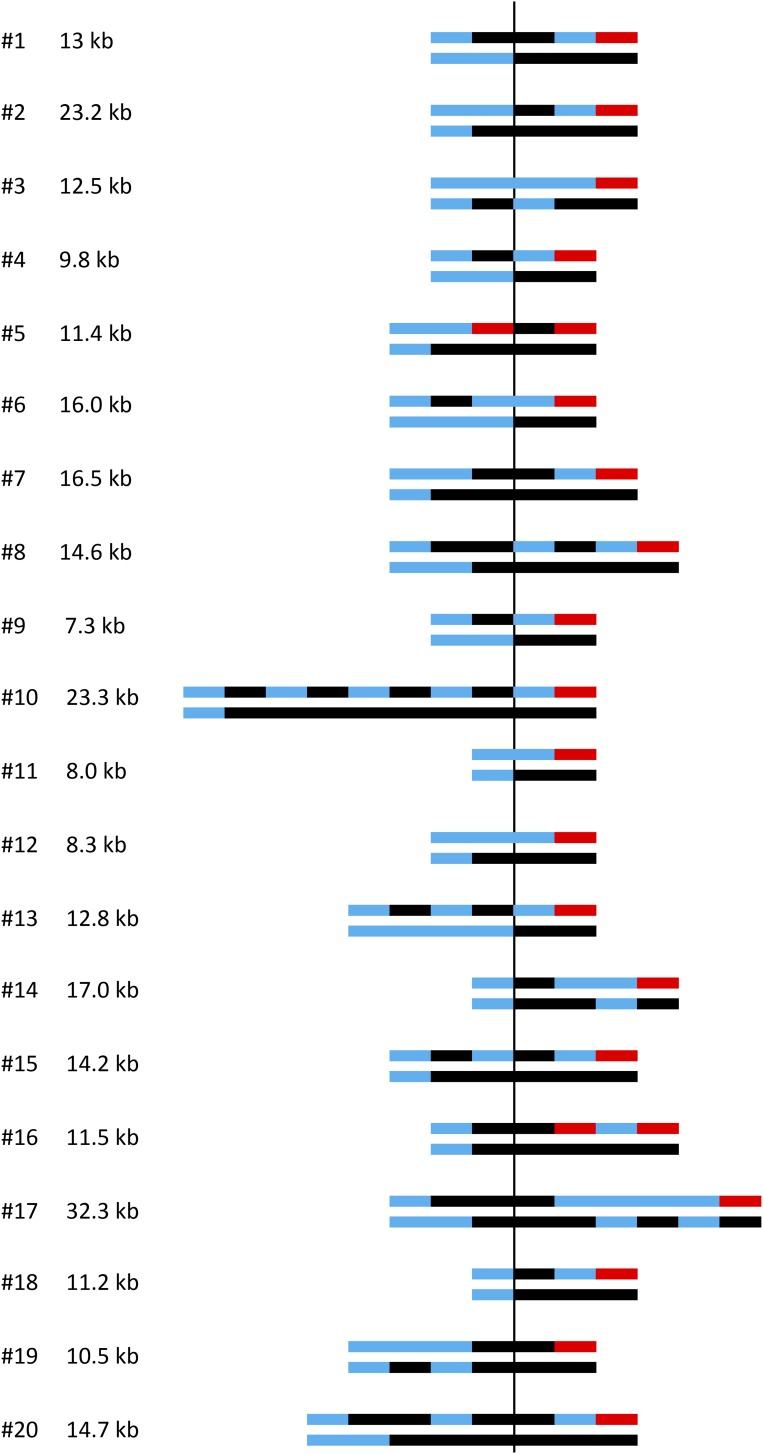
Figure 4.
Summary of the transitions from heterozygosity to homozygosity in red–white sectored colonies. The shorthand depiction of chromosomes in each sector of the 20 colonies analyzed is presented as in Figure 3C. Transitions are aligned relative to initiating DSB (vertical line), and the GC tract length in each colony is given. The GC length was determined as the distance between the position of the first centromere-proximal transition from heterozygosity to homozygosity and the last telomere-proximal transition from heterozygosity to terminal homozygosity. Multiple transitions most often occurred in the red sector, which contains a CO chromosome and the repaired NCO red chromosome. Blocks of heterozygosity (blue lines) and homozygosity (black and red lines) are not to scale.

