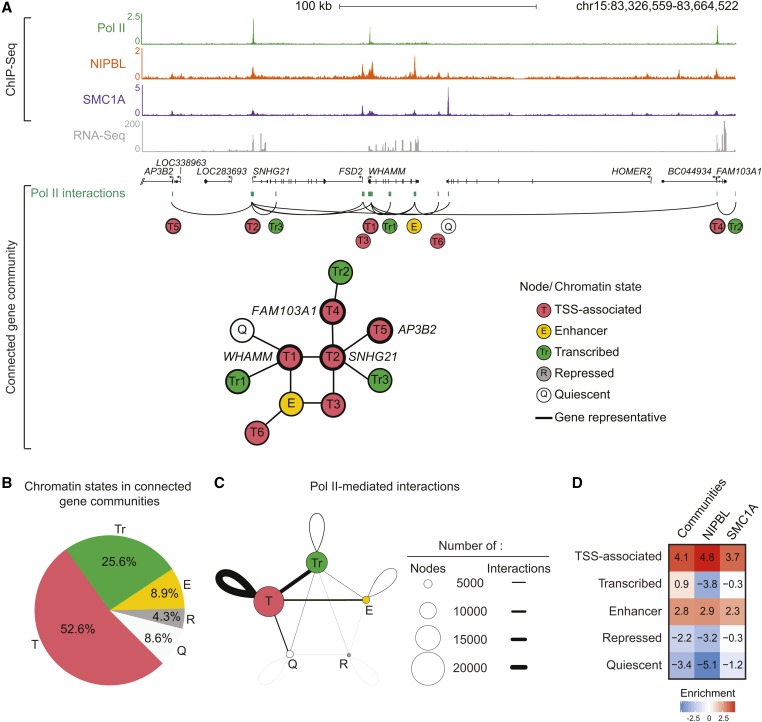
Figure 2.
Active noncoding regulatory regions are occupied by NIPBL and cohesin within connected gene communities. (A) Representation of a connected gene community containing the WHAM, SNHG21, FAM103A1, and AP3B2 loci. First, ChIP-Seq occupancy profiles of Pol II, NIPBL, SMC1A and RNA-Seq are shown in GM12878 cells. The scales of ChIP-Seq and RNA-Seq profiles are displayed in reads per million. Connected gene communities were created by integrating the Pol II ChIA-PET interaction data (green boxes) (see Materials and Methods and Tang et al. (2015)). The represented community contains 11 nodes individually annotated using the simplified chromatin state model [pink: TSS-associated (T), yellow: enhancer (E), green: transcribed (Tr), dark gray: repressed (R), and light gray: quiescent (Q)]. Interacting regions overlapping an annotated TSS were defined as gene representatives. (B) Distribution of chromatin states within connected gene communities. The pie chart shows the average percentage of each simplified chromatin state (pink: T, yellow: E, green: Tr, dark gray: R, and light gray: Q) within a connected gene community. (C) Pol II-mediated interactions between chromatin states within connected gene communities. Each circle represents a simplified chromatin state (pink: T, yellow: E, green: Tr, dark gray: R, and light gray: Q). The size of the circle corresponds to the frequency of the chromatin state within connected gene communities. The thickness of the lines represents the frequency of interactions between the different chromatin states. TSS-associated nodes are the most prevalent and involved in the highest frequency of interactions. (D) Heatmap showing the enrichment of simplified chromatin states within connected gene communities compared to all NIPBL- and SMC1A-occupied regions. The enrichment fold was calculated relative to the genome. NIPBL and SMC1A are enriched at TSS-associated and enhancer regions, similar to connected gene communities. The color scale indicates the enrichment vs. the genome. CdLS, Cornelia de Lange syndrome; ChIA-PET, Chromatin Interaction Analysis by Paired-End Tag Sequencing; ChIP-Seq, chromatin immunoprecipitation sequencing; chr, chromosome; Pol II, RNA polymerase II; RNA-Seq, RNA sequencing; TSS, transcription start site.

