Figure 3.
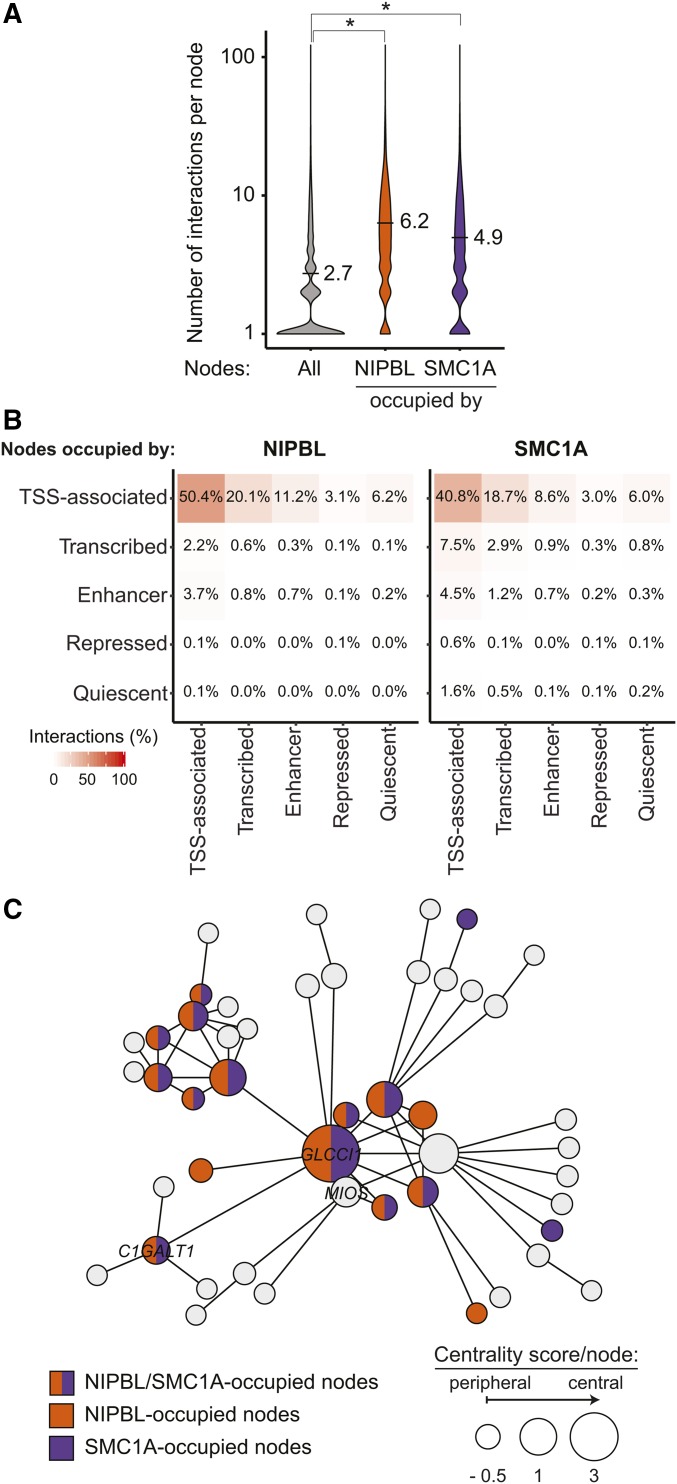
Nodes occupied by NIPBL and cohesin create more interactions. (A) Violin plots representing the connectivity of NIPBL- and SMC1A-occupied nodes. The number of interactions for all nodes is displayed in gray while those for NIPBL- and SMC1A-occupied nodes are displayed in orange and purple, respectively. On average, nodes occupied by NIPBL and SMC1A are involved in 6.2 (P ≤ 2.2e−16, Wilcoxon rank sum test) and 4.9 (P ≤ 2.2e−16, Wilcoxon rank sum test) interactions compared to 2.7 for all nodes within connected gene communities. (B) Nodes occupied by NIPBL and SMC1A are mostly involved in inter-TSS interactions. Contact heatmap representing the proportion of nodes occupied by NIPBL and SMC1A involved in chromosome interactions between each simplified chromatin states. The color scale indicates the percentage of interactions. (C) NIPBL and SMC1A occupy central nodes. Representation of a connected gene community where the size of each node is proportional to the centrality score. The bigger the circle, the more central the node is. Gene names are indicated in nodes overlapping a TSS-proximal (±1 kb) region. Nodes are colored in function of their occupancy: NIPBL (orange), SMC1A (purple), both (orange and purple), or none (gray). TSS, transcription start site.

