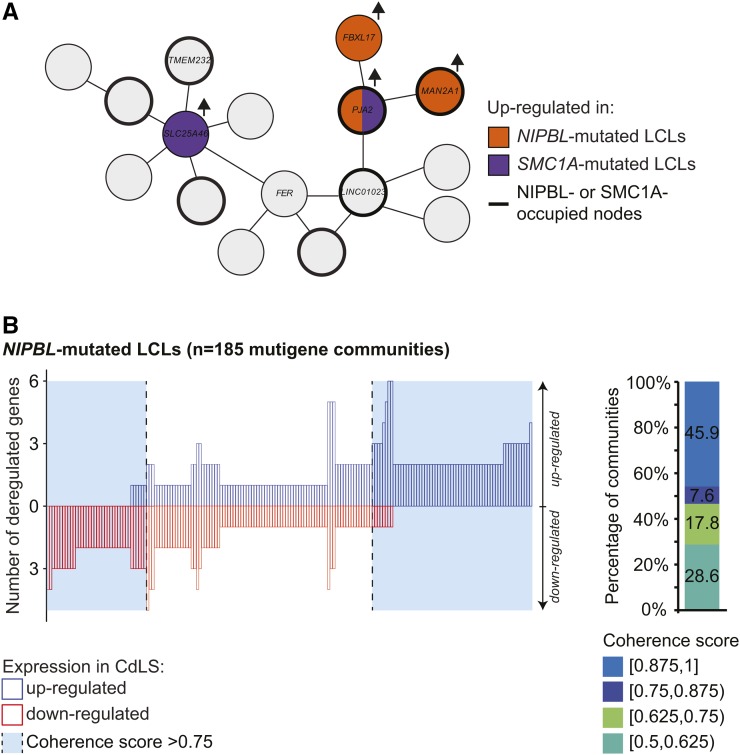
Figure 5.
Coordinated deregulation of gene expression is associated with NIPBL mutations. (A) Example of a connected gene community containing seven genes (TMEM232, SLC25A46, FER, LINC01023, PJA2, FBXL17, and MAN2A1). Gene names are indicated in nodes overlapping an annotated TSS. Genes upregulated in NIPBL-mutated (orange), SMC1A-mutated (purple), or both (orange and purple) LCLs are highlighted. Nodes occupied by NIPBL or SMC1A are identified by a thicker line. (B) Coordinated gene expression changes in connected gene communities are associated with mutations in NIPBL. Left panel: quantification of the number of up- and downregulated genes in CdLS within individual multigene connected gene communities. Communities with at least 75% of coherency are highlighted in light blue. Right panel: distribution of coherence score of connected gene communities. A coherence score of 1 represents that all CdLS-modulated genes are deregulated in the same direction. CdLS, Cornelia de Lange syndrome; LCLs, lymphoblastoid cell lines; TSS, transcription start site.

