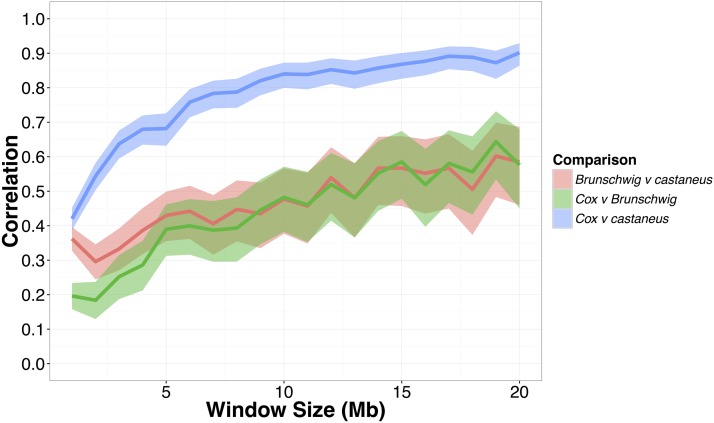
Figure 3.
Pearson correlation coefficients between the recombination map inferred for M. m. castaneus, the Brunschwig et al. (2012) map and the Cox et al. (2009) map. Correlations were calculated in nonoverlapping windows of varying size across all autosomes. Confidence intervals (95%) are indicated by shading.

