Figure 2.
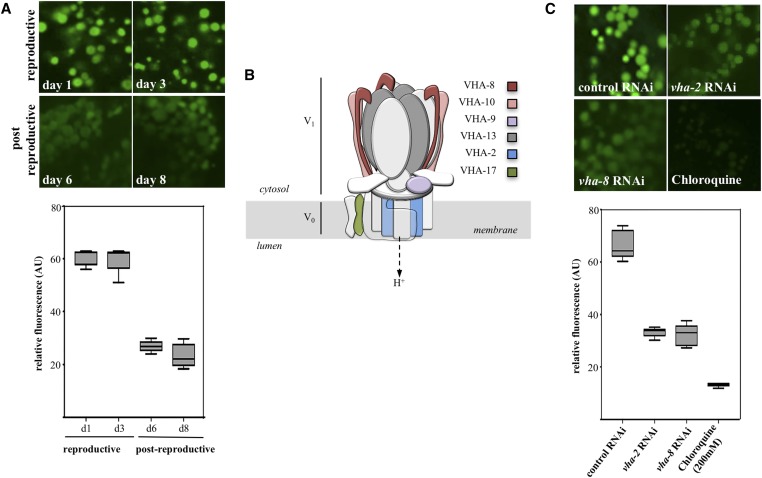
Loss of lysosome acidity in the transition to postreproductive life. (A) cDCFDA imaging of intestinal lysosomes in wild-type reproductive (day 1 and 3) and postreproductive (day 6 and 8) stages. The corresponding quantified average fluorescent values are shown in the bottom. The differences in signal intensities between day 1 and 3 (reproductive) and day 6 and 8 (postreproductive) were not significant (P = 0.8203 and P = 0.1496, respectively). (B) Schematic representation of the v-ATPase complex assembled on the lysosomal membrane. The subunits mentioned in this work are indicated. (C) cDCFDA imaging of intestinal lysosomes of worms in reproductive stage (day 2) after control RNAi, vha-2 RNAi, vha-8 RNA or treatment with 200 mM of chloroquine. The corresponding quantified average fluorescent values are shown in the bottom. The difference between cDCFDA signals between the RNAi knockdowns of the two protein pumps was not significant (P = 0.5922).

