Figure 1.

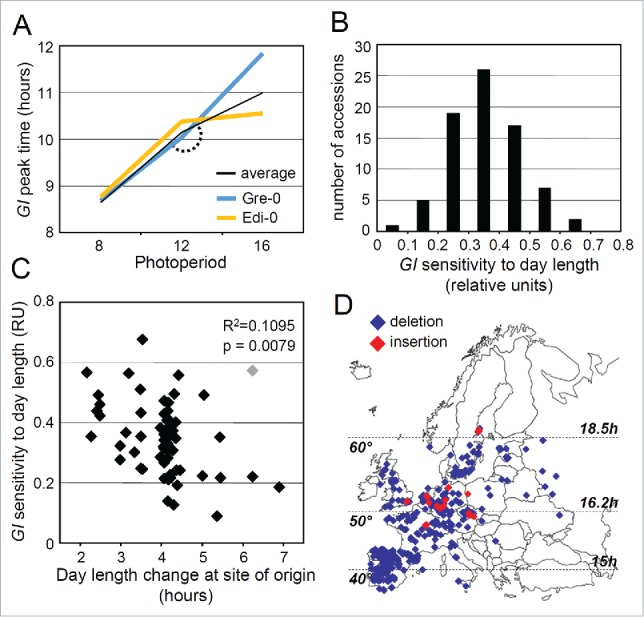
Arabidopsis accessions from northern latitudes show reduced sensitivity of GI expression to changing photoperiods. The measurement of GI peak time in the accessions and the description of how the transgenic lines were obtained are described in.8 (A) GI peak time in the 2 accessions Gre-0 and Edi-0 grown in SDs of 8 h, LDs of 12 h and LDs of 16 h. These 2 accessions were chosen to illustrate the variation in the response of GI to photoperiod changes from LDs of 12 h to LDs of 16 h. (B) For each accession, the sensitivity of GI to photoperiod (from LDs of 12 to 16 h) was estimated by calculating the absolute peak time difference between both day lengths, but also by calculating the relative peak time variation and the angle of the response as described in Table 1. The angle of the response is illustrated by the arc in A. The distribution of the relative GI peak time variation is shown in B. (C) Relative GI peak time variation negatively correlates with the day length changes that the accessions experience in spring at their site of origin (between the 21st of March and the 21st of June). Results of the correlations presented on the plot include one outlier (in gray on the plot). When the outlier was removed the results of the Pearson test were R2 = 0.1936 and p = 0.0003. The day length data were determined based on the geographical coordinates of each accession obtained from.44 Only the 63 accessions whose geographical origin had been tested in44 were included in the analysis. (D) Geographical distribution of the PHYB indel. The accessions used in this analysis included the 77 accessions described in,8 accessions from the Hapmap collection,45 and iberian accessions described in.26 In total 576 accessions were tested for the presence of the insertion, out of which 228 were from latitudes below 47° N. Only European accessions were considered, with the coordinates of the most eastern accessions being 38°28′ E. In house genotyping was necessary to verify the presence of the insertion because the available resequencing data of Arabidopsis accessions (http://www.1001genomes.org/) in most cases failed to detect the deletion. The presence of the insertion was tested by PCR using primers PHYBfw (5′–3′: TTCACCCTAAATCCTTCCTTGTCTC) and PHYBrev (5′–3′: CGTCGTCGTTTTGAGTGATTGTG). Horizontal dashed lines indicate latitudes 40°, 50° and 60°. The corresponding day lengths at summer solstice are indicated on the right of the panel.
