Figure 3.

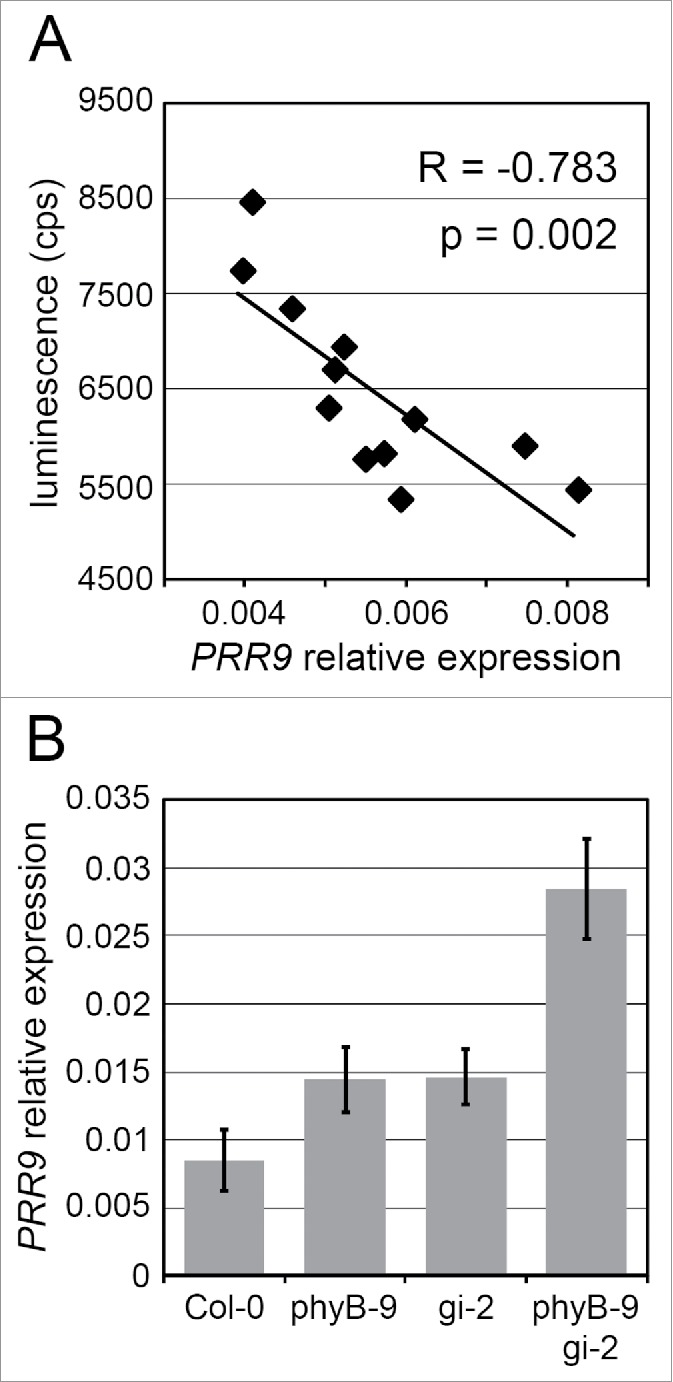
Variation of GI expression correlates with PRR9 expression. Generation of the 12 NILs and measurements of GI expression with the luciferase system are described in.8 GI::LUC expression levels at the time of peak (or GI maximum expression) were obtained for each NIL from 5 independent experiments, with 12 individuals per genotype per experiment. As described previously for PIF4,8 PRR9 mRNA levels were quantified in the different genotypes after 10 d of entrainment in LDs of 16 h, and samples were harvested 20 hours after dawn. (A) Correlation of GI maximum expression in the NILs with PRR9 mRNA. cps: counts per second. (B) PRR9 mRNA levels quantified by qRT-PCR in Col-0, phyB-9, gi-2 and phyB-9 gi-2. PCR conditions and cycles were as described in,8 and PRR9 expression was quantified by qRT-PCR using primers PRR9fw (ATCAAAAGCTTAGCCTCTCTG) and PRR9rev (CTGTGGACTGAAGAACTTGGTTAC). The isopentenyl pyrophosphate / dimethylallyl pyrophosphate isomerase (IPP2) was used as a housekeeping gene for normalization. Erros bars represent SD of 4 technical replicates.
