

Abstract
Background
Detection of preclinical cardiac dysfunction and prognosis of left ventricular heart failure (HF) would allow targeted intervention, and appears to be the most promising approach in its management. Novel biomarker panels may support this approach and provide new insights into the pathophysiology.
Methods and Results
A retrospective comparison of urinary proteomic profiles generated by mass spectrometric analysis from 49 HF patients, 36 patients who progressed to HF within 2.6±1.6 years, and 192 sex‐ and age‐matched controls who did not progress to HF enabled identification of 96 potentially HF‐specific peptide biomarkers. Based on these 96 peptides, the classifier called Heart Failure Predictor (HFP) was established by support vector machine modeling. The incremental prognostic value of HFP was subsequently evaluated in urine samples from 175 individuals with asymptomatic diastolic dysfunction from an independent population cohort. Within 4.8 years, 17 of these individuals progressed to overt HF. The area under receiver‐operating characteristic curve was 0.70 (95% CI, 0.56–0.82); P=0.0047 for HFP and 0.57 (0.42–0.72; P=0.62) for N‐terminal pro b‐type natriuretic peptide. Hazard ratios were 1.63 (CI, 1.04–2.55; P=0.032) per 1‐SD increment in HFP and 0.70 (CI, 0.35–1.41; P=0.32) for a doubling of the logarithmically transformed N‐terminal pro b‐type natriuretic peptide.
Conclusions
HFP is a novel biomarker derived from the urinary proteome and might serve as a sensitive tool to improve risk stratification, patient management, and understanding of the pathophysiology of HF.
Keywords: biomarker, heart failure, proteomics, risk stratification
Subject Categories: Heart Failure, Prognosis, Biomarkers
Clinical Perspective
What Is New?
We identified a novel multidimensional urinary biomarker consisting of 96 peptide fragments and named it heart failure predictor.
Heart failure predictor predicts progression from asymptomatic left ventricular dysfunction to overt heart failure and is more accurate than a research‐optimized N‐terminal pro b‐type natriuretic peptide assay.
What Are the Clinical Implications?
Heart failure predictor might serve as a tool to improve risk stratification, patient management, and understanding the pathophysiology of heart failure.
Introduction
Left ventricular (LV) heart failure (HF) is a clinical syndrome caused by adverse LV structural or functional alterations resulting in impaired ventricular filling and/or ejection and thus in the disability of the heart to pump a sufficient amount of blood to meet the metabolic needs of the body.1, 2 HF represents an enormous public health and socioeconomic burden.1, 2 Because of etiological diversity, it is difficult to clearly identify all contributing factors in a clinical setting and to depict the complex pathophysiology by single biomarkers. Difficulties thus arise in diagnosis, risk stratification, and management of HF patients.2 A position paper of the American Heart Association supported research into proteomics as applied to cardiovascular health and disease.3 In line with this recommendation, we developed multidimensional proteomic biomarkers characterizing distinct molecular manifestations of LV dysfunction that may provide additional diagnostic and prognostic value and identify new targets of treatment. We already identified specific peptide biomarker patterns helping in the diagnosis of coronary artery disease,4 and asymptomatic LV diastolic5, 6and systolic7 dysfunction. The present study aimed to extend the findings5, 6, 7 of these case–control5, 7 and cross‐sectional6 studies and to investigate whether the urinary proteomic signature might predict progression from asymptomatic LV dysfunction to overt symptomatic HF.
Methods
Study Participants
For discovery of the urinary biomarkers, we investigated 95 patients enrolled in the GS (Generation Scotland: Scottish Family Health Study),8 who had either HF at baseline (n=57) or progressed to HF during follow‐up (n=38) and 192 sex‐ and age‐matched healthy controls selected from the same cohort. For validation, we studied 175 patients with asymptomatic diastolic LV dysfunction at baseline enrolled in the FLEMENGHO (Flemish Study on Environment, Genes and Health Outcomes5, 6), of whom over a 4.8‐year period 17 developed HF during follow‐up. The diagnosis of HF was ascertained against the records held by general practitioners or hospitals in the catchment area of the FLEMENGHO study.9 Both GS (ethical approval registration number, 10/S1402/20) and FLEMENGHO (ML4804) complied with the Helsinki declaration for research in humans10 and received ethical approval. Permission for health record linkage in GS was obtained from the Privacy Advisory Committee of NHS National Services Scotland. The FLEMENGHO database is registered with the Belgian Privacy Commission (www.privacycommission.be). All participants gave informed written consent.
Definition of LV Dysfunction
In the GS study,8 HF was an ICD‐coded admission to the hospital for symptomatic HF. In FLEMENGHO,5, 6 the diagnosis of subclinical LV diastolic dysfunction relied on echocardiography. To ascertain the absence of symptoms, participants completed the London School of Hygiene questionnaires on cardiovascular and respiratory symptoms.11 As described elsewhere,12 guideline‐driven echocardiographic criteria to stage patients with advanced diastolic LV dysfunction leave a large proportion of people unclassified in population studies. We therefore developed age‐specific criteria in a healthy reference sample drawn from FLEMENGHO12 and replicated these criteria in an independent European population study.13 Diastolic LV dysfunction included12, 13: (1) patients with an abnormally low age‐specific transmitral E/A ratio indicative of impaired relaxation, but without evidence of increased LV filling pressures (E/e′ ≤8.5); (2) patients with a mildly‐to‐moderately elevated LV filling pressure (E/e′ >8.5) and an E/A ratio within the normal age‐specific range; and (3) patients with an elevated E/e′ ratio and an abnormally low age‐specific E/A ratio (combined dysfunction).
Proteomic Urine Sample Analysis
Sample preparation and capillary electrophoresis–mass spectrometry analysis
For proteomic analysis, a 0.7‐mL aliquot of stored urine was thawed immediately before use and diluted with 0.7 mL of 2 mol/L urea, and 10 mmol/L NH4OH containing 0.02% sodium dodecyl sulphate. To remove higher molecular mass proteins, such as albumin and immunoglobulins, the sample was ultrafiltered using Centrisart ultracentrifugation filter devices (20 kDa MWCO; Sartorius, Göttingen, Germany) at 3000 relative centrifugal force units until 1.1 mL of filtrate was obtained. This filtrate was then applied onto a PD‐10 desalting column (GE Healthcare, Uppsala, Sweden) equilibrated in 0.01% NH4OH in HPLC‐grade in H2O (Carl Roth GmbH, Karlsruhe, Germany) to decrease matrix effects by removing urea, electrolytes, salts, and to enrich polypeptides. Finally, all samples were lyophilized, stored at 4°C, and suspended in HPLC‐grade H2O shortly before capillary electrophoresis–mass spectrometry (CE‐MS) analyses.14
CE‐MS analyses were performed using a P/ACE MDQ capillary electrophoresis system (Beckman Coulter, Fullerton, CA) on‐line coupled to a micrOTOF MS (Bruker Daltonics, Bremen, Germany).14, 15 The electrospray ionization device (Agilent Technologies, Palo Alto, CA) was grounded, and the ion spray interface potential was set between −4 and −4.5 kV. Data acquisition and MS acquisition methods were automatically controlled by the CE via contact‐close‐relays. Spectra were accumulated every 3 s, over a mass‐to‐charge ratio (m/z) ranging from 350 to 3000.
Quality control
Accuracy, precision, selectivity, sensitivity, reproducibility (Figure 1), and stability of the CE‐MS have been previously published.14, 16 Quality control involves daily CE‐MS runs of human urine standards.16 CE has a high reproducibility with at least 70% of peptide recovered compared with only 43% by liquid chromatography. To prevent variability because of carry‐over effects from 1 to the next run, capillaries are reconditioned between runs (eg, 1 mol/L NaOH). Figure 1 shows proteome coverage of 6 CE‐MS runs of human urine standards. The coefficient of variance estimated from over 600 urine samples collected once daily for over 3 years was 5.8%.17
Figure 1.
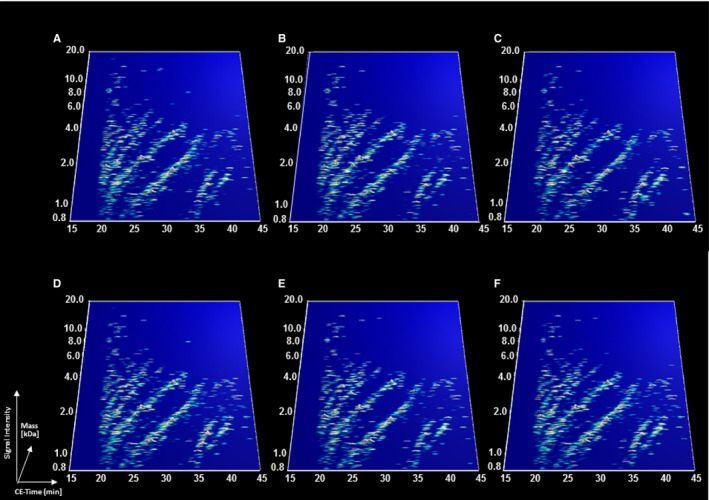
Proteome coverage of 6 CE‐MS runs (A through F) of human urine standards. The molecular mass on a logarithmic scale (0.8–20 kDa on the y‐axis) was plotted against the normalized CE migration time (15–45 minutes on the x‐axis). Peak height and color represent average signal intensity. The human urine standard is a urine sample from a randomly selected healthy person that is used for quality control.16 CE‐MS indicates capillary electrophoresis–mass spectrometry.
Mass spectrometric data processing
Mass spectral peaks representing identical molecules at different charge states were deconvoluted into single masses, using MosaiquesVisu software.18 Only signals with z of more than 1 observed in a minimum of 3 consecutive spectra with a signal‐to‐noise ratio of at least 4 were considered. Reference signals of 1770 urinary polypeptides were used for CE‐time calibration by locally weighted regression. For normalization of analytical and urine dilution variances, signal intensities were normalized relative to 29 “housekeeping” peptides.19, 20 The obtained peak lists characterize each polypeptide by its molecular mass, normalized CE migration time, and normalized signal intensity. All detected peptides were deposited, matched, and annotated in a Microsoft SQL database, allowing further statistical analysis.21 For clustering, peptides in different samples were considered identical, if mass deviation was <50 ppm. CE migration time was controlled to be below 0.35 minutes after calibration.
Sequencing of polypeptides
HF biomarkers were in silico assigned to the previously sequenced peptides from Human Urinary Proteome Database, version 2.0.22 Peptides from this database were sequenced, as described elsewhere.23, 24 Briefly, urinary peptides were fragmented using different tandem mass spectrometric techniques with a prior separation step with CE or HPLC. Fragmentation spectra were matched to the protein sequences from up‐to‐date public databases (IPI, NCBI Reference Sequence Database and Uniprot), using MS/MS search engines MASCOT (Matrix Sciences Ltd., London, UK) and OMSSA (National Center for Biotechnology Information, Bethesda, MD). In matching, we accounted for urinary proteins posttranslational modifications, such as hydroxylation of lysine and proline, and specific MS characteristics. Peptide sequences from liquid chromatography–MS analyses were verified by the comparison of experimental and theoretical CE migration time, which is dependent on the number of basic and neutral polar amino acids.
Identified HF‐specific urinary peptides were combined into a single multidimensional classifier called Heart Failure Predictor (HFP), using the support vector machine‐based MosaCluster software, version 1.7.0.25 MosaCluster calculates classification scores based on the amplitudes of the selected biomarkers. Classification is performed by determining the Euclidian distance (defined as the support‐vector machine classification score) of the vector to a maximal margin hyperplane. The parameters for derivation of the HFP classifier were 6.4 for C, 0.008192 for gamma, and 0.001 for epsilon. In sensitivity analyses, we forced sex and age into the computations of the classification scores.
Other Measurements
Hypertension was a blood pressure of at least 140 mm Hg systolic or 90 mm Hg diastolic or use of antihypertensive drugs. Venous blood samples were drawn after at least 6 hours of fasting for measurement of plasma glucose and serum total and high‐density lipoprotein cholesterol and serum creatinine. We derived the estimated glomerular filtration rate from serum creatinine by the Modification of Diet in Renal Disease formula.26 Diabetes mellitus was a self‐reported diagnosis, a fasting glucose level of at least 7 mmol/L, or use of antidiabetic agents.27 In the GS study,8 N‐terminal proatrial natriuretic peptide (NT‐proBNP) was measured using an automated ELISA assay (Roche Diagnostics, Basel, Switzerland) with an interassay coefficient of variation of <3%. The lower limit of detection was 5 pg of NT‐proBNP per mL. In the FLEMENGHO study,12, 13 NT‐proBNP was measured in plasma by a competitive enzyme immunoassay for research use (Biomedica Gruppe, Vienna, Austria).28 The interassay and intra‐assay variations were lower than 15%. The lower detection limit was 5 pmol of NT‐proBNP/L. The standard range provided by the manufacturer of the enzyme immunoassay is from 0 to 1000 pmol/L (median, 208 pmol/L; 95% percentile, 300 pmol/L).
Statistical Analysis
We compared means and proportions characterizing the study participants at baseline by Student t test and Fisher exact test, respectively. We compared urinary peptide levels with a detectable signal in at least 30% of participants by the nonparametric Wilcoxon rank sum test. Unadjusted P values were calculated using the normal approximation of the Wilcoxon test statistic. In the GS study, we applied the Benjamini‐Hochberg approach with the false discovery rate set at 5%.29 We used Cox regression to compute hazard ratios and to determine clinical characteristics relevant for progression to overt HF. We identified covariables to be retained by a backward elimination with the P value set at 0.1. Variables with physiological relevance that were not retained by the stepdown procedure were combined in a propensity score30 derived by regressing HFP on covariables, including sex, body mass index, mean arterial pressure, heart rate, LV mass index, treatment with inhibitors of the renin system, and use of β‐blockers. To account for the small sample size in the replication sample (FLEMENGHO5, 6), we applied Firth regression.31 In FLEMENGHO participants,5, 6 we evaluated the discriminatory performance of HFP by constructing the receiver operating characteristic curve and calculating the area under the receiver operating characteristic curve.
Results
Design of HFP in the GS Study
Cases were 57 patients with overt HF (ICD10 code, I50.1) present at baseline and 38 patients who over a 5‐year follow‐up period progressed to symptomatic HF requiring hospitalization (median time to event, 2.9 years). Among cases with incident HF, 19 (50%) had elevated levels of NT‐proBNP (>125 pg/mL) at baseline. Controls were 192 sex‐ and age‐matched healthy individuals with normal NT‐proBNP level (Table 1).
Table 1.
Baseline Characteristics of Cases and Controls Nested in the GS
| Characteristic | HF at Baseline | Incident HF | Healthy Controls |
|---|---|---|---|
| Number | 57 | 38 | 192 |
| Number of subjects, % | |||
| Women | 18 (31.6) | 12 (31.6) | 61 (31.3) |
| Hypertension | 46 (80.7) | 26 (68.6) | 157 (81.8) |
| Diabetes mellitus | 9 (15.8) | 3 (7.9) | 8 (4.2) |
| Obesity | 23 (41.1) | 10 (26.3) | 42 (22.0) |
| Mean (SD) of characteristic | |||
| Age, y | 69±10a | 64±11 | 64±9 |
| Body mass index, kg/m2 | 29±5a | 28±5 | 27±5 |
| Waist‐to‐hip ratio | 0.94±0.08a | 0.91±0.07 | 0.91±0.09 |
| Blood pressure, mm Hg | |||
| Systolic pressure | 136±23 | 143±21 | 141±17 |
| Diastolic pressure | 78±13a | 81±12a | 82±10 |
| Heart rate, beats per minute | 68±12 | 70±14 | 67±11 |
| Biochemical data | |||
| Serum creatinine, μmol/L | 94±28a | 85±19a | 80±13 |
| eGFR, mL/min per 1.73 m2 | 74±22a | 80±17a | 85±15 |
| Total cholesterol, mmol/L | 4.3±1.0a | 4.9±1.4a | 5.2±1.1 |
| HDL cholesterol, mmol/L | 1.2±0.4a | 1.3±0.4a | 1.4±0.4 |
| Plasma glucose, mmol/L | 5.8±2.2a | 5.2±1.6a | 5.1±1.3 |
| NT‐proBNP, pg/mL | 278 (93–774)a | 132 (69–242)a | 48 (32–72) |
Values are mean (±SD) or geometric mean (interquartile range). Hypertension was an office blood pressure of ≥140 mm Hg systolic, ≥90 mm Hg diastolic, or use of antihypertensive drugs. Diabetes mellitus was a self‐reported diagnosis, a fasting glucose level of at least 7 mmol/L, or use of antidiabetic agents. Obesity was a body mass index of ≥30 kg/m2. For NT‐proBNP, values are geometric mean (interquartile range). eGFR indicates estimated glomerular filtration rate; HDL, high‐density lipoprotein; HF, heart failure; NT‐proBNP, N‐terminal pro‐b‐type natriuretic peptide.
Indicates a difference (P≤0.05) between cases and controls.
Impaired renal function is a potential confounder in urinary biomarker discovery.32 We therefore excluded the 10 patients with an estimated glomerular filtration rate of <45 mL/min per 1.73 m2 (stage 3B according to the National Kidney Foundation Kidney Disease Outcomes Quality Initiative guideline [www.kidney.org]) from biomarker discovery, leaving 49 with overt HF at baseline and 36 with incident HF. The total number of detected peptide fragments was 5616, but only 1380 (24.6%) with a signal in at least 30% of study participants were analyzed. Of these 1380 peptides (Figure 2), 722 were not sequenced and 658 were sequenced. The sequenced peptides enabled identification of 157 parent proteins. Comparison of cases and controls with the false discovery rate set at 5% identified 96 potential peptide biomarkers, of which 59 were characterized by sequence and posttranslational modification (Table 2). The majority of the sequenced peptides originated from the extracellular matrix and were fragments of collagen I (n=33), III (n=10), as well as collagen IV, VII, and IX (each n=1). Other peptides originated from α‐1‐antitrypsin, fibrinogen α (n=2), kininogen‐1, microtubule‐associated protein τ, osteopontin (n=2), plasma protease C1 inhibitor, and serum albumin (Table 2).
Figure 2.
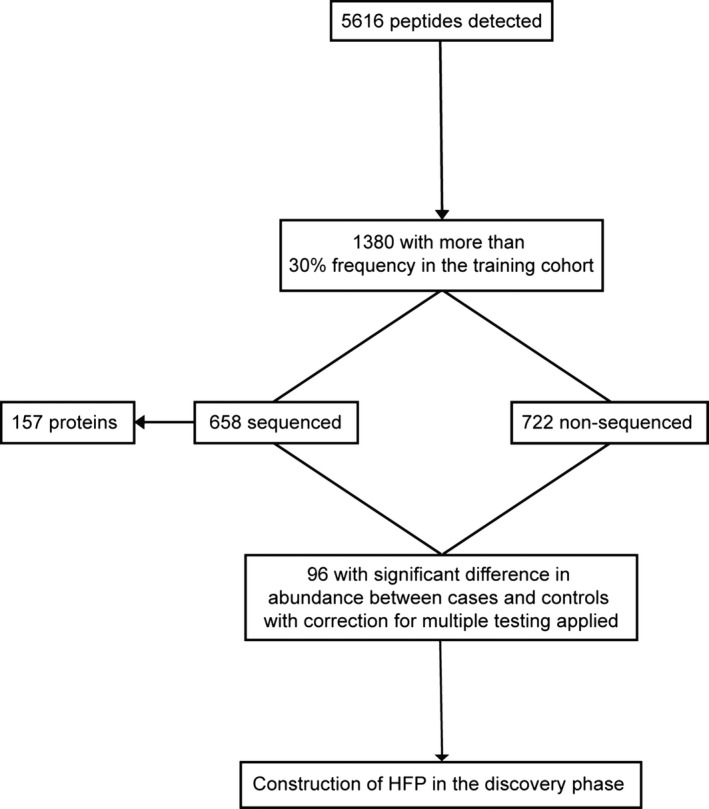
Flow chart illustrating the peptides retained in the generation of HFP. HFP indicates Heart Failure Predictor.
Table 2.
Sequenced Peptides Included in the Heart Failure‐Specific Peptide Panel in the GS Cohort
| ID | Sequence | Protein Name | Accession Number | BAS | INC | Overlap |
|---|---|---|---|---|---|---|
| 107929 | DAaHKSEVAHRFKDLGEENFKALVL | Serum albumin | P02768 | +28.1 | +44.5 | |
| 2505 | SpGEAGRpG | Collagen α‐1(I) chain | P02452 | −2.2 | −1.3 | 2 |
| 2659 | DDGEAGKpG | Collagen α‐1(I) chain | P02452 | −2.1 | −1.2 | 2 |
| 5675 | DGKTGPpGPA | Collagen α‐1(I) chain | P02452 | −2.1 | −1.2 | |
| 14906 | DGRpGPpGPpG | Collagen α‐1(I) chain | P02452 | −2.7 | −1.4 | 2 |
| 16779 | ApGDRGEpGPP | Collagen α‐1(I) chain | P02452 | −2.8 | +1.3 | |
| 17694 | ApGDRGEpGpP | Collagen α‐1(I) chain | P02452 | −2.8 | −1.3 | 2 |
| 21365 | PpGEAGKpGEQG | Collagen α‐1(I) chain | P02452 | +1.8 | −1.0 | 2 |
| 23697 | DDGEAGKpGRpG | Collagen α‐1(I) chain | P02452 | −2.1 | −1.2 | 1 |
| 28561 | SpGPDGKTGPpGPA | Collagen α‐1(I) chain | P02452 | −2.9 | −1.5 | 1,2 |
| 30575 | SpGSpGPDGKTGPp | Collagen α‐1(I) chain | P02452 | −3.3 | −1.2 | |
| 32171 | ApGDRGEpGPpGPA | Collagen α‐1(I) chain | P02452 | −1.5 | −1.2 | 1,2 |
| 35339 | ApGDRGEpGPpGPAG | Collagen α‐1(I) chain | P02452 | −1.4 | −1.1 | 1,2 |
| 42594 | VGPpGpPGPPGPPGPPS | Collagen α‐1(I) chain | P02452 | −1.8 | −1.2 | |
| 43442 | VGPpGPpGPpGPPGPPS | Collagen α‐1(I) chain | P02452 | −1.4 | −1.1 | |
| 50638 | PpGPpGKNGDDGEAGKP | Collagen α‐1(I) chain | P02452 | −2.1 | +1.1 | |
| 51175 | EGSpGRDGSpGAKGDRG | Collagen α‐1(I) chain | P02452 | −2.3 | +1.1 | |
| 51875 | VGPpGPpGPpGPPGPPSAG | Collagen α‐1(I) chain | P02452 | +1.6 | +1.1 | |
| 62504 | TGPIGPpGPAGApGDKGESGP | Collagen α‐1(I) chain | P02452 | +2.1 | +1.2 | |
| 63209 | EGSpGRDGSpGAKGDRGET | Collagen α‐1(I) chain | P02452 | −2.0 | −1.1 | 2 |
| 65257 | SGEpGApGSKGDTGAKGEpGP | Collagen α‐1(I) chain | P02452 | +1.7 | +3.2 | 2 |
| 72896 | SGEpGApGSKGDTGAKGEpGPVG | Collagen α‐1(I) chain | P02452 | +1.2 | +1.4 | |
| 75846 | GPpGEAGKpGEQGVpGDLGApGP | Collagen α‐1(I) chain | P02452 | +1.2 | +1.3 | |
| 77018 | DGQPGAKGEpGDAGAKGDAGPPGp | Collagen α‐1(I) chain | P02452 | +1.2 | +1.4 | |
| 78073 | AEGSpGRDGSpGAKGDRGETGPA | Collagen α‐1(I) chain | P02452 | −1.1 | −2.1 | |
| 81457 | IGPpGPAGApGDKGESGPSGPAGPTG | Collagen α‐1(I) chain | P02452 | −1.1 | −1.8 | |
| 82234 | IGPpGPAGApGDkGESGPSGPAGPTG | Collagen α‐1(I) chain | P02452 | −1.2 | −2.6 | |
| 87460 | KGNSGEPGApGSKGDTGAKGEPGPVG | Collagen α‐1(I) chain | P02452 | +1.5 | +1.9 | |
| 99808 | LTGPIGPPGpAGApGDKGESGPSGPAGPTG | Collagen α‐1(I) chain | P02452 | −1.2 | −1.2 | |
| 118163 | LTGSpGSpGpDGKTGPPGPAGQDGRPGPpGppG | Collagen α‐1(I) chain | P02452 | −1.1 | −1.5 | |
| 36769 | DGPpGRDGQpGHKG | Collagen α‐2(I) chain | P08123 | −1.2 | −2.1 | |
| 48093 | GpAGPRGERGPpGESGA | Collagen α‐2(I) chain | P08123 | +1.2 | +2.0 | 2 |
| 110240 | LKGQpGApGVKGEpGApGENGTPGQTGARG | Collagen α‐2(I) chain | P08123 | +7.7 | +2.2 | |
| 114086 | TGEVGAVGPpGFAGEKGPSGEAGTAGPpGTpGP | Collagen α‐2(I) chain | P08123 | +1.3 | +2.0 | |
| 18988 | DGESGRpGRpG | Collagen α‐1(III) chain | P02461 | −1.2 | −3.0 | |
| 28747 | SpGERGETGPpGP | Collagen α‐1(III) chain | P02461 | +1.1 | +1.4 | 1 |
| 30699 | DGApGKNGERGGpG | Collagen α‐1(III) chain | P02461 | −1.0 | −2.4 | 2 |
| 36784 | DGVPGKDGPRGPTGP | Collagen α‐1(III) chain | P02461 | +1.0 | +2.0 | 2 |
| 38798 | GLpGTGGPpGENGKpG | Collagen α‐1(III) chain | P02461 | −1.1 | −2.1 | 2 |
| 49295 | ApGGKGDAGApGERGPpG | Collagen α‐1(III) chain | P02461 | +1.2 | +1.8 | |
| 61304 | GLpGTGGPpGENGKPGEPGp | Collagen α‐1(III) chain | P02461 | +1.5 | +3.6 | 2 |
| 61945 | GLpGTGGPpGENGKpGEPGp | Collagen α‐1(III) chain | P02461 | +1.6 | +2.6 | 2 |
| 64887 | GApGApGGKGDAGApGERGPpG | Collagen α‐1(III) chain | P02461 | +1.3 | +2.4 | |
| 107460 | KNGETGPQGPPGPTGPGGDKGDTGPpGpQG | Collagen α‐1(III) chain | P02461 | −1.2 | −1.7 | 1 |
| 84484 | pGFPGAQGEPGSQGEpGDpGLpGP | Collagen α‐2(IV) chain | P08572 | +1.6 | +2.8 | |
| 30500 | GApGLAGpAGpQGpS | Collagen α‐1(VII) chain | Q02388–2 | +1.7 | +2.1 | |
| 86029 | PpGppGPpGVPGSDGIDGDNGPPGK | Collagen α‐2(IX) chain | H0Y409 | +1.3 | +2.0 | |
| 129940 | DVGSYQEKVDVVLGPIQLQTPPRREEEPR | Deleted in malignant brain tumors 1 protein | Q9UGM3 | +1.4 | +2.0 | |
| 98089 | DEAGSEADHEGTHSTKRGHAKSRP | Fibrinogen α chain | P02671 | +1.6 | +2.4 | 1 |
| 103912 | DEAGSEADHEGTHSTKRGHAKSRPV | Fibrinogen α chain | P02671 | +1.4 | +1.9 | |
| 17968 | DGGGSPKGDVDP | Sodium/potassium–transporting ATPase subunit γ | P54710 | −1.2 | −1.4 | 2 |
| 13747 | ATKTVGSDTF | Kininogen‐1 | P01042–2 | +1.1 | −2.8 | |
| 67263 | GSGGSSYGSGGGSYGSGGGGGGGRG | Keratin; type II cytoskeletal 1 | P04264 | −1.1 | −1.6 | |
| 59368 | FGASAGTGDLSDNHDIIS | Vesicular integral–membrane protein VIP36 | Q12907 | +1.7 | +3.0 | |
| 73434 | KDQGGYTmHQDQEGDTDAG | Microtubule–associated protein τ; MAPT | P10636 | −1.3 | −1.7 | 1 |
| 87692 | EDPQGDAAQKTDTSHHDQDHP | Short peptide from AAT | G3V387 | −1.3 | −2.1 | |
| 73015 | ELTETGVEAAAASAISVARTL | Plasma protease C1 inhibitor | P05155 | +1.9 | +5.7 | |
| 111426 | IPVKQADSGSSEEKQLYNKYPDAVAT | Osteopontin | P10451 | +1.9 | +1.5 | |
| 118694 | IPVKQADSGSSEEKQLYNKYPDAVATW | Osteopontin | P10451 | +2.9 | +7.1 |
The analysis of 49 cases with HF at baseline (BAS), 36 cases with incident HF (INC), and 192 controls identified 59 differentially excreted peptides that could be sequenced. The accession number is the identifier in the UniProtKB database (www.uniprot.org). BAS and INC are fold changes of amplitude comparing heart failure cases at baseline (BAS) and incident heart failure at follow‐up (INC) to normal controls, respectively. The differential excretion was computed as (amplitude cases×frequency)/(amplitude control×frequency) or as (amplitude controls×frequency)/(amplitude cases×frequency) for upregulated (+) and downregulated (−) proteins in cases vs controls, respectively. Amplitude refers to the average mass spectrometric signal and frequency to the number of individuals with a detectable signal. Overlap refers to the peptide fragments also included in the previously published HF1 (1; reference 5) and HF patients with reduced ejection fraction (2; reference 7) classifiers. HF indicates heart failure.
To reduce overfitting in the support vector machine modeling, for the generation of a novel multidimensional classifier for HF, we included all available 95 cases, irrespective of their renal function. The resulting classifier, HFP (threshold level −0.22), allowed correct discrimination of 57 patients with HF at baseline and 38 patients with incident HF versus 192 controls with 100% accuracy upon complete take‐1‐out cross‐validation. HFP had 11 (11.5%) peptide fragments in common with the earlier published classifiers HF1 developed in hypertensive patients with asymptomatic LV diastolic dysfunction5, 6 and shared 22 (22.9%) peptides with HFrEF103 derived in HF patients with reduced ejection fraction.7 Twenty‐two of these common peptides have a known sequence (Table 2). Forcing sex and age into the computations of the classification scores did not affect the performance of HFP.
Replication of HFP in the FLEMENGHO Study
The prognostic utility of HFP was assessed in the independent FLEMENGHO cohort by applying the classifier onto the proteome profiles of 175 individuals with asymptomatic LV diastolic dysfunction but without previous coronary events (Table 3). Median follow‐up was 4.7 years (interquartile range, 4.5–5.1; range, 1.1–8.4 years) in 158 patients who did not progress to HF and 5.0 years (interquartile range, 4.4–6.2; range, 3.4–7.2) in 17 patients who developed overt diastolic HF (P=0.20). In stepdown Cox regression, age was the only covariable retaining significance. With adjustment for age and the propensity score, the hazard ratio for HF associated with HFP in Firth regression was 1.64 (CI, 1.05–2.53; P=0.029) for a 1‐SD increment. The corresponding hazard ratio for logarithmically transformed NT‐proBNP was 0.70 (CI, 0.36–1.38; P=0.31). In similarly adjusted models including both biomarkers, the hazard ratios were 1.63 (CI, 1.04–2.55; P=0.032) for HFP and 0.70 (CI, 0.35–1.41; P=0.32) for NT‐proBNP.
Table 3.
Baseline Characteristics of Cases and Controls in the FLEMENGHO Study
| Characteristic | Cases | Controls |
|---|---|---|
| Number | 17 | 158 |
| Number of subjects, % | ||
| Women | 11 (64.7) | 90 (57.0) |
| Hypertension | 13 (76.5) | 128 (81.0) |
| Diabetes mellitus | 3 (17.7) | 13 (8.2) |
| Obesity | 4 (23.5) | 52 (32.9) |
| Mean (SD) of characteristic | ||
| Age, y | 72±6a | 64±13 |
| Body mass index, kg/m2 | 28±4 | 28±4 |
| Waist‐to‐hip ratio | 0.89±0.08 | 0.90±0.08 |
| Blood pressure, mm Hg | ||
| Systolic pressure | 142±19 | 143±19 |
| Diastolic pressure | 76±9a | 82±10 |
| Heart rate, beats per minute | 55±11a | 63±11 |
| Biochemical data | ||
| Serum creatinine, μmol/L | 85±19 | 87±21 |
| eGFR, mL/min per 1.73 m2 | 71±16 | 72±14 |
| Total cholesterol, mmol/L | 5.4±0.8 | 5.5±1.0 |
| HDL cholesterol, mmol/L | 1.5±0.3 | 1.4±0.3 |
| Plasma glucose, mmol/L | 5.6±1.9 | 5.2±1.1 |
| NT‐proBNP, pmol/L | 269 (251–432) | 245 (166–389) |
| Echocardiography data | ||
| LVEF, % | 68±9 | 70±9 |
| e′ peak, cm/s | 7.5±1.7 | 7.7±1.9 |
| E/e′ | 9.9±2.6 | 9.2±2.9 |
Values are mean (±SD) or geometric mean (interquartile range). Hypertension was an office blood pressure of ≥140 mm Hg systolic, ≥90 mm Hg diastolic, or use of antihypertensive drugs. Diabetes mellitus was a self‐reported diagnosis, a fasting glucose level of at least 7 mmol/L, or use of antidiabetic agents. Obesity was a body mass index of ≥30 kg/m2. For NT‐proBNP, values are geometric mean (interquartile range). eGFR indicates estimated glomerular filtration rate; FLEMENGHO, Flemish Study on Environment, Genes and Health Outcomes; HDL, high‐density lipoprotein; HF, heart failure; LVEF, left ventricular ejection fraction; NT‐proBNP, N‐terminal pro‐b‐type natriuretic peptide.
Indicates a difference (P≤0.05) between cases and controls.
The area under the receiver operating characteristic curve for NT‐proBNP was 0.57 (95% CI, 0.42–0.72; P=0.62). For HFP, the area under the receiver operating characteristic curve was 0.70 (CI, 0.56–0.82; P=0.0047; Figure 3). The performance of the classifier made up of only type I collagens fragments (n=33) generated an area under the receiver operating characteristic curve of 0.60 (CI, 0.44–0.76; P=0.21).
Figure 3.
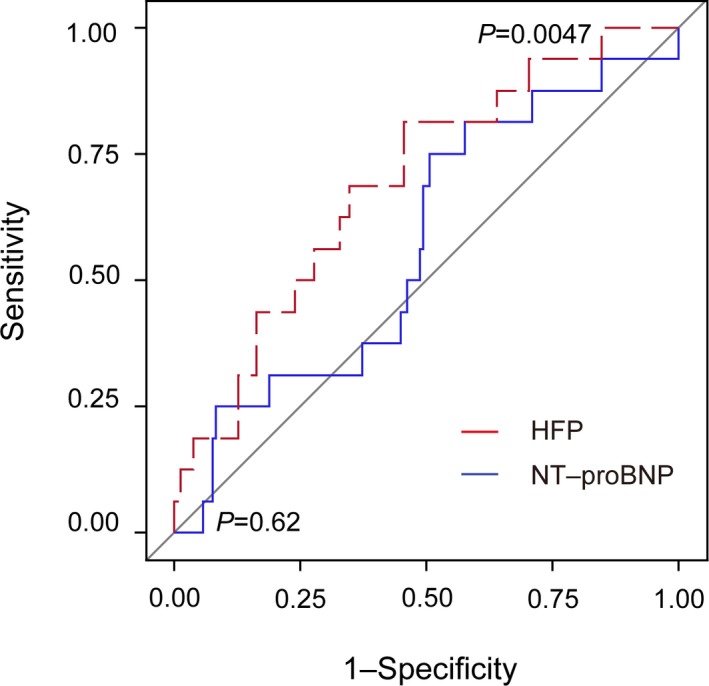
Receiver operating characteristic curve for the HFP score factors and NT‐proBNP values of the comparison between patients with preclinical left ventricular diastolic dysfunction who did and did not progress to overt heart failure in the FLEMENGHO cohort. FLEMENGHO indicates the Flemish Study on Environment, Genes and Health Outcomes; HFP, Heart Failure Predictor; NT‐proBNP, N‐terminal pro b‐type natriuretic peptide.
Discussion
We identified urinary peptide biomarkers with prognostic value for the progression from asymptomatic LV dysfunction to overt HF. The ensuing multidimensional classifier HFP surpassed a research‐optimized NT‐proBNP assay in the prediction of progression to symptomatic HF. NT‐ProBNP, an inactive fragment of the cleaved pro‐BNP molecule, is the guideline‐endorsed state‐of‐the‐art clinical marker to confirm HF diagnosis.33
From a mechanistic point of view, HFP extensively depicts specific excretory molecular phenotypic alterations associated with progressive LV dysfunction. Fragments of fibrillar type I and III collagen, important components of the myocardial extracellular matrix,34 predominantly make up the proteomic urinary signature associated with HF. These observations are in line with altered collagen synthesis,35 chemical/enzymatic cross‐linking,36 and/or turnover by different proteases35, 37 as the mechanisms underlying the perturbed LV mechanics and geometry38, 39 and progression to HF.40 Renal dysfunction secondary to HF32 might also have contributed to the urinary peptide excretion pattern as captured by HFP.
In addition to collagens, the biomarker pattern included peptide fragments from α‐1‐antitrypsin and osteopontin, which showed an elevated differential excretion in cases (Table 2). Levels of α‐1‐antitrypsin progressively increase across the New York Heart Association classes of HF and correlate with B‐type natriuretic peptide.41 This might be a compensatory mechanism for the loss of anti‐protease activity as a consequence of oxidative stress. The presence of a kininogen‐1 fragment in HFP indicated that alterations in kininogen‐1 and therefore kinins, its cleavage products, may also be relevant for the diagnosis and prediction of HF. Kinins, such as bradykinin (kallidin‐I) and lysyl‐bradykinin (kallidin‐II), are potent vasoactive and inflammatory peptides acting through the formation of nitric oxide radicals and prostacyclin.42 Inhibition of kinin degradation by angiotensin‐converting enzyme inhibitors increases LV ejection fraction and decreases the LV end‐diastolic volume,43 thereby underscoring the relevance of kinins in the pathophysiology of HF. Moreover, in line with the observed increased HF‐related excretion of osteopontin and altered excretion of collagen type I and III, López and coworkers demonstrated that elevated expression of osteopontin in HF patients correlated with collagen cross‐linking lysyl oxidase and insoluble collagen.44 Combined with NT‐proBNP, osteopontin improves the diagnosis of acute heart failure and refines risk stratification.45
Conclusions
HFP is a novel biomarker derived from the urinary proteome and might serve as a tool to improve risk stratification, patient management, and understanding of the pathophysiology of HF. While the prognostic utility of HFP has been validated in a fully independent cohort, our study must be interpreted within the context of its limitations. First, the number of patients progressing to overt HF in the validation cohort was relatively small (9.7%), thus limiting the statistical assessment of the prognostic utility. However, we applied Firth regression as a bias‐corrected approach to conventional Cox regression. Second, we derived HFP from peptides with a detectable signal in at least 30% of study participants. Incomplete data might be perceived as a weakness. However, ignoring biomarkers with missing values wastes potentially important information, explaining why in proteomic studies missing values of 50% or more are commonly accepted without consensus about the threshold to be applied. Moreover, the 30% threshold in this article is in keeping with our previously published peer‐reviewed research. Third, the fact that not all identified polypeptides were sequenced impedes to some extent the insight into the pathophysiological mechanisms underlying HF. Finally, our current study cannot prove the origin of the urinary collagen fragments. However, we are now running proteomics on biopsies taken from explanted (diseased) and implanted (healthy) hearts during cardiac transplantation surgery in an attempt to prove that the urinary and tissue proteomic signatures are similar (http://erc.europa.eu/projects-and-results/erc-funded-projects/prophet). In spite of these limitations, our study underscores the diagnostic and prognostic power of a multidimensional biomarker approach. Further studies are necessary to reach the high level of evidence sufficient to establish HFP as a clinically valuable test.
Sources of Funding
The project was partly funded by the European Union grants EU‐MASCARA (HEALTH‐F7‐278249). Generation Scotland received core support from the Chief Scientist Office of the Scottish Government Health Directorates (CZD/16/6) and the Scottish Funding Council (HR03006). The Ministry of Economy and Competitiveness, Madrid, Spain (Carlos III Institute of Health, CIBER‐CV CB16/11/00483). The European Union (HEALTH‐F7‐305507) HOMAGE and the European Research Council (Advanced Researcher Grant 2011‐294713‐EPLORE and Proof‐of‐Concept Grant 713601‐uPROPHET) and the Fonds voor Wetenschappelijk Onderzoek Vlaanderen, Ministry of the Flemish Community, Brussels, Belgium (G.0881.13, G.088013, and 11Z0916N) currently support the Studies Coordinating Centre in Leuven.
Disclosures
Koeck and Nkuipou‐Kenfack are employees of Mosaiques‐Diagnostics GmbH. Mischak is the CEO of Mosaiques‐Diagnostics GmbH. None of the other authors declared a conflict of interest.
Acknowledgments
We gratefully acknowledge the contribution of the whole Generation Scotland team and the nursing and clerical staff at the Studies Coordinating Centre in Leuven, Belgium.
(J Am Heart Assoc. 2017;6:e005432 DOI: 10.1161/JAHA.116.005432.)28784649
References
- 1. Paulus WJ, Tschöpe C, Sanderson JE, Rusconi C, Flachskampf FA, Rademakers FE, Marino P, Smiseth OA, De Keulenaer G, Leite‐Moreira AF, Borbély A, Edes I, Handoko ML, Heymans S, Pezzali N, Pieske B, Dickstein K, Fraser AG, Brutsaert DL. How to diagnose heart failure: a consensus statement on the diagnosis of heart failure with normal left ventricular ejection fraction by the Heart Failure and Echocardiography Associations of the European Society of Cardiology. Eur Heart J. 2007;28:2539–2550. [DOI] [PubMed] [Google Scholar]
- 2. McMurray JJ, Adamopoulous S, Anker SD, Auricchio A, Böhm M, Dickstein K, Falk V, Filippatos G, Fonseca C, Gomez‐Sanchez MA, Jaarsma T, Koøber L, Lip GY, Maggioni AP, Parkhomenko A, Pieske BM, Popescu BA, Rønnevik PK, Rutten FH, Schwitter J, Seferovic P, Stepinska J, Trindade PT, Voors AA, Zannad F, Zeiher A; ESC Committee for Practice Guidelines . ESC guidelines for the diagnosis and treatment of acute and chronic heart failure 2012: the Task Force for the Diagnosis and Treatment of Acute and Chronic Heart Failure 2012 of the European Society of Cardiology. Developed in collaboration with the Heart Failure Association (HFA) of the ESC. Eur Heart J. 2012;33:1787–1847. [DOI] [PubMed] [Google Scholar]
- 3. Lindsey ML, Mayr M, Gomes AV, Delles C, Arrell DK, Murphy AM, Lange RA, Costello CE, Jin YF, Laskowitz DT, Sam F, Terzic A, Van Eyk J, Srinivas PR; American Heart Association Council on Clinical Cardiology, Council on Cardiovascular Disease in the Young, Council on Clinical Cardiology, Council on Cardiovascular and Stroke Nursing, Council on Hypertension, Stroke Council . Transformative impact of proteomics on cardiovascular health and disease: a scientific statement from the American Heart Association. Circulation. 2015;132:852–872. [DOI] [PubMed] [Google Scholar]
- 4. Zimmerli LU, Schiffer E, Zürbig P, Good DM, Kellmann M, Mouls L, Pitt AR, Coon JJ, Schmieder RE, Peter KH, Mischak H, Kolch W, Delles C, Dominiczak AF. Urinary proteomic biomarkers in coronary artery disease. Mol Cell Proteomics. 2008;7:290–298. [DOI] [PubMed] [Google Scholar]
- 5. Kuznetsova T, Mischak H, Mullen W, Staessen J. Urinary proteome analysis in hypertensive patients with left ventricular diastolic dysfunction. Eur Heart J. 2012;33:2342–2350. [DOI] [PMC free article] [PubMed] [Google Scholar]
- 6. Zhang Z, Staessen JA, Thijs L, Gu Y, Liu Y, Jacobs L, Koeck T, Zürbig P, Mischak H, Kuznetsova T. Left ventricular diastolic dysfunction in relation to the urinary proteome: a proof‐of‐concept study in a general population. Int J Cardiol. 2014;176:158–165. [DOI] [PMC free article] [PubMed] [Google Scholar]
- 7. Rossing K, Bosselmann HS, Gustafsson F, Zhang ZY, Gu YM, Kuznetsova T, Nkuipou‐Kenfack E, Mischak H, Staessen JA, Koeck T, Schou M. Urinary proteomics pilot study for biomarker discovery and diagnosis in heart failure with reduced ejection fraction. PLoS One. 2016;11:e0157167. [DOI] [PMC free article] [PubMed] [Google Scholar]
- 8. Smith BH, Campbell A, Linksted P, Fitzpatrick B, Jackson C, Kerr SM, Deary IJ, Macintyre DJ, Campbell H, McGilchrist M, Hocking LJ, Wisely L, Ford I, Lindsay RS, Morton R, Palmer CN, Dominiczak AF, Porteous DJ, Morris AD. Cohort profile: Generation Scotland: Scottish Family Health Study (GS:SFHS). The study, its participants and their potential for genetic research on health and illness. Int J Epidemiol. 2013;42:689–700. [DOI] [PubMed] [Google Scholar]
- 9. Zhang ZY, Thijs L, Petit T, Gu YM, Jacobs L, Yang WY, Liu YP, Koeck T, Zürbig P, Verhamme P, Voigt JU, Kuznetsova T, Mischak H, Staessen JA. The urinary proteome and systolic blood pressure as predictors of 5‐year cardiovascular and cardiac outcomes in a general population. Hypertension. 2015;66:52–60. [DOI] [PubMed] [Google Scholar]
- 10. World Medical Association . Declaration of Helsinki. JAMA. 2013;227:184–189. [Google Scholar]
- 11. Rose GA, Blackburn H. Méthodes d’ Enquête Sur Les Maladies Cardio‐Vasculaires. Geneva, Switzerland: World Health Organization; 1969:185–191. [Google Scholar]
- 12. Kuznetsova T, Herbots L, López B, Jin Y, Richart T, Thijs L, González A, Herregods MC, Fagard RH, Díez J, Staessen JA. Prevalence of left ventricular diastolic dysfunction in a general population. Circ Heart Fail. 2009;2:105–112. [DOI] [PubMed] [Google Scholar]
- 13. Kloch‐Badelek M, Kuznetsova T, Sakiewicz W, Tikhonoff V, Ryabikov A, González A, Loster M, Thijs L, Jin Y, Malyutina S, Stolarz‐Skrzypek K, Casiglia E, Díez J, Narkiewicz K, Kawecka‐Jaszcz K, Staessen JA; on behalf of the European Project on Genes in Hypertension (EPOGH) Investigators . Prevalence of diastolic left ventricular dysfunction in European populations based on cross‐validated diagnostic thresholds. Cardiovasc Ultrasound. 2012;10:10. [DOI] [PMC free article] [PubMed] [Google Scholar]
- 14. Theodorescu D, Wittke S, Ross MM, Walden M, Conaway M, Just I, Mischak H, Frierson HF. Discovery and validation of new protein biomarkers for urothelial cancer: a prospective analysis. Lancet Oncol. 2006;7:230–240. [DOI] [PubMed] [Google Scholar]
- 15. Wittke S, Mischak H, Walden M, Kolch W, Rädler T, Wiedemann K. Discovery of biomarkers in human urine and cerebrospinal fluid by capillary electrophoresis coupled to mass spectrometry: towards new diagnostic and therapeutic approaches. Electrophoresis. 2005;26:1476–1487. [DOI] [PubMed] [Google Scholar]
- 16. Mischak H, Kolch W, Aivalotis M, Bouyssie D, Court M, Dihazi H, Dihazi GH, Franke J, Garin J, Gonzalez de Peredo A, Iphöfer A, Jänsch L, Lacroix C, Makridakis M, Masselon C, Metzger J, Monsarrat B, Mrug M, Norling M, Novak J, Pich A, Pitt A, Bongcam‐Rudloff E, Siwy J, Suzuki H, Thongboonkerd V, Wang LS, Zoidakis J, Zürbig P, Schanstra JP, Vlahou A. Comprehensive human urine standards for comparability and standardization in clinical proteome analysis. Proteomics Clin Appl. 2010;4:464–478. [DOI] [PMC free article] [PubMed] [Google Scholar]
- 17. Mischak H, Vlahou A, Ioannidis JP. Technical aspects and inter‐laboratory variability in native peptide profiling: the CE‐MS experience. Clin Biochem. 2013;46:432–443. [DOI] [PubMed] [Google Scholar]
- 18. Neuhoff NV, Kaiser T, Wittke S, Krebs R, Pitt A, Burchard A, Sundmacher A, Schlegelberger B, Kolch W, Mischak H. Mass spectrometry for the detection of differentially expressed proteins: a comparison of surface‐enhanced laser desorption/ionization and capillary electrophoresis/mass spectrometry. Rapid Commun Mass Spectrom. 2004;18:149–156. [DOI] [PubMed] [Google Scholar]
- 19. Haubitz M, Good DM, Woywodt A, Haller H, Rupprecht H, Theodorescu D, Dakna M, Coon JJ, Mischak H. Identification and validation of urinary biomarkers for differential diagnosis and evaluation of therapeutic intervention in anti‐neutrophil cytoplasmic antibody‐associated vasculitis. Mol Cell Proteomics. 2009;8:2296–2307. [DOI] [PMC free article] [PubMed] [Google Scholar]
- 20. Jantos‐Siwy J, Schiffer E, Brand K, Schumann G, Rossing K, Delles C, Mischak H, Metzger J. Quantitative urinary proteome analysis for biomarker evaluation in chronic kidney disease. J Proteome Res. 2009;8:268–281. [DOI] [PubMed] [Google Scholar]
- 21. Dakna M, He Z, Yu WC, Mischak H, Kolch W. Technical, bioinformatical and statistical aspects of liquid chromatography‐mass spectrometry (LC‐MS) and capillary electrophoresis‐mass spectrometry (CE‐MS) based clinical proteomics: a critical assessment. J Chromatogr B Analyt Technol Biomed Life Sci. 2009;877:1250–1258. [DOI] [PubMed] [Google Scholar]
- 22. Stalmach A, Albalat A, Mullen W, Mischak H. Recent advances in capillary electrophoresis coupled to mass spectrometry for clinical proteomic applications. Electrophoresis. 2013;34:1452–1464. [DOI] [PubMed] [Google Scholar]
- 23. Coon JJ, Zürbig P, Dakna M, Dominiczak AF, Decramer S, Fliser D, Frommberger M, Golovko I, Good DM, Herget‐Rosenthal S, Jankowski J, Julian BA, Kellmann M, Kolch W, Massy Z, Novak J, Rossing K, Schanstra JP, Schiffer E, Theodorescu D, Vanholder R, Weissinger EM, Mischak H, Schmitt‐Kopplin P. CE‐MS analysis of the human urinary proteome for biomarker discovery and disease diagnostics. Proteomics Clin Appl. 2008;2:964–973. [DOI] [PMC free article] [PubMed] [Google Scholar]
- 24. Rossing K, Mischak H, Dakna M, Zürbig P, Novak J, Julian BA, Good DM, Coon JJ, Tarnow L, Rossing P; on behalf of the PREDICTIONS Network . Urinary proteomics in diabetes and CKD. J Am Soc Nephrol. 2008;19:1283–1290. [DOI] [PMC free article] [PubMed] [Google Scholar]
- 25. Delles C, Schiffer E, von Zur Muhlen C, Peter K, Rossing P, Parving HH, Dymott JA, Neisius U, Zimmerli LU, Snell‐Bergeon JK, Maahs DM, Schmieder RE, Mischak H, Dominiczak AF. Urinary proteomic diagnosis of coronary artery disease: identification and clinical validation in 623 individuals. J Hypertens. 2010;28:2316–2322. [DOI] [PubMed] [Google Scholar]
- 26. Levey AS, Bosch JP, Lewis JB, Greene T, Rogers N, Roth D; for the Modification of Diet in Renal Disease Study Group . A more accurate method to estimate glomerular filtration rate from serum creatinine: a new prediction equation. Ann Intern Med. 1999;130:461–470. [DOI] [PubMed] [Google Scholar]
- 27. Expert Committee on the Diagnosis and Classification of Diabetes Mellitus . Report of the expert committee on the diagnosis and classification of diabetes mellitus. Diabetes Care. 2003;26(suppl 1):S5–S20. [DOI] [PubMed] [Google Scholar]
- 28. Mueller T, Gegenhuber A, Poelz W, Haltmayer M. Comparison of the Biomedica NT‐pro BNP enzyme immunoassay and the Roche NT‐pro BNP chemiluminescence immunoassay: implication for the prediction of symptomatic and asymptomatic structural heart disease. Clin Chem. 2003;49:976–979. [DOI] [PubMed] [Google Scholar]
- 29. Benjamini Y, Hochberg Y. Controlling the false discovery rate: a practical and powerful approach to multiple testing. J R Stat Soc B. 1995;57:289–300. [Google Scholar]
- 30. Austin PC. An introduction to propensity score methods for reducing the effects of confounding in observational studies. Multivariate Behav Res. 2011;46:399–424. [DOI] [PMC free article] [PubMed] [Google Scholar]
- 31. Firth D. Bias reduction of maximum likelihood estimates. Biometrika. 1993;80:27–38. [Google Scholar]
- 32. Mentz RJ, Kelly JP, von Lueder TG, Voors AA, Lam CS, Cowie MR, Kjeldsen K, Jankowska EA, Atar D, Butler J, Fiuzat M, Zannad F, Pitt B, O'Connor CM. Noncardiac comorbidities in heart failure with reduced versus preserved ejection fraction. J Am Coll Cardiol. 2014;64:2281–2293. [DOI] [PMC free article] [PubMed] [Google Scholar]
- 33. Pouleur AC. Which biomarkers do clinicians need for diagnosis and management of heart failure with reduced ejection fraction? Clin Chim Acta. 2015;443:9–16. [DOI] [PubMed] [Google Scholar]
- 34. Weber KT. Cardiac interstitium in health and disease: the fibrillar collagen network. J Am Coll Cardiol. 1989;13:1637–1652. [DOI] [PubMed] [Google Scholar]
- 35. Löfsögard J, Kahan T, Díez J, López B, González A, Edner M, Henriksson P, Mejhert M, Persson H. Biomarkers of collagen type I metabolism are related to B‐type natriuretic peptide, left ventricular size, and diastolic function in heart failure. J Cardiovasc Med (Hagerstown). 2014;15:463–469. [DOI] [PubMed] [Google Scholar]
- 36. Shoulders MD, Raines RT. Collagen structure and stability. Annu Rev Biochem. 2009;78:929–958. [DOI] [PMC free article] [PubMed] [Google Scholar]
- 37. Toprak G, Yüksel H, Demirpence Ö, Islamoglu Y, Evliyaoglu O, Mete N. Fibrosis in heart failure subtypes. Eur Rev Med Pharmacol Sci. 2013;17:2302–2309. [PubMed] [Google Scholar]
- 38. Kasner M, Westermann D, Lopez B, Gaub R, Escher F, Kühl U, Schultheiss HP, Tschöpe C. Diastolic tissue Doppler indexes correlate with the degree of collagen expression and cross‐linking in heart failure and normal ejection fraction. J Am Coll Cardiol. 2011;57:977–985. [DOI] [PubMed] [Google Scholar]
- 39. López B, Querejeta R, González A, Larman M, Díez J. Collagen cross‐linking but not collagen amount associates with elevated filling pressures in hypertensive patients with stage C heart failure. Potential role of lysyl oxidase. Hypertension. 2012;60:677–683. [DOI] [PubMed] [Google Scholar]
- 40. López B, Ravassa S, González A, Zubillaga E, Bonavila C, Bergés M, Echegaray K, Beamont J, Moreno MU, San José G, Larman M, Querejeta R, Díez J. Myocardial collagen cross‐linking is associated with heart failure hospitalization in patients with hypertensive heart failure. J Am Coll Cardiol. 2016;67:251–260. [DOI] [PubMed] [Google Scholar]
- 41. Lubrano V, Papa A, Pingitore A, Cocci F. Alpha‐1 protein evaluation to stratify heart failure patients. J Cardiovasc Med (Hagerstown). 2014. DOI:10.2459/JCM.0000000000000016. [DOI] [PubMed] [Google Scholar]
- 42. Lee CS, Tkacs NC. Current concepts of neurohormonal activation in heart failure: mediators and mechanisms. AACN Adv Crit Care. 2008;19:364–385. [DOI] [PubMed] [Google Scholar]
- 43. Liu YH, Yang XP, Mehta D, Bulagannawar M, Scicli GM, Carretero OA. Role of kinins in chronic heart failure and in the therapeutic effect of ACE inhibitors in kininogen‐deficient rats. Am J Physiol Heart Circ Physiol. 2000;278:H507–H514. [DOI] [PubMed] [Google Scholar]
- 44. López B, González A, Lindner D, Westermann D, Ravassa S, Beaumont J, Gallego I, Zudaire A, Brugnolaro C, Querejeta R, Larman M, Tschöpe C, Díez J. Osteopontin‐mediated myocardial fibrosis in heart failure: a role for lysyl oxidase? Cardiovasc Res. 2013;99:111–120. [DOI] [PubMed] [Google Scholar]
- 45. Behnes M, Brueckmann M, Lang S, Espeter F, Weiss C, Neumaier M, Ahmad‐Nejad P, Borggrefe M, Hoffmann U. Diagnostic and prognostic value of osteopontin in patients with acute congestive heart failure. Eur J Heart Fail. 2013;15:1390–1400. [DOI] [PubMed] [Google Scholar]