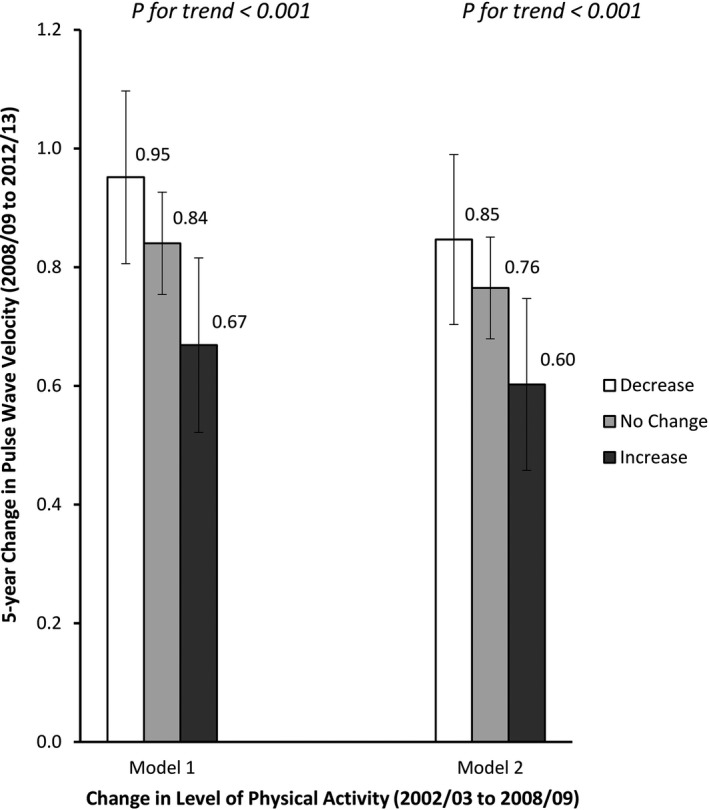
Figure 1.

Five‐year change in pulse wave velocity (between average age 65 to 70 years) by change in level of physical activity (between average age 60 to 65 years). Model 1 values are adjusted for age, sex, ethnicity, and mean arterial pressure. Model 2 values are additionally adjusted for heart rate, body mass index, waist circumference, smoking, alcohol intake, total cholesterol levels, history of cardiovascular disease, diabetes mellitus, and hypertension medication. Error bars represent 95% CI.
