
Figure 2.
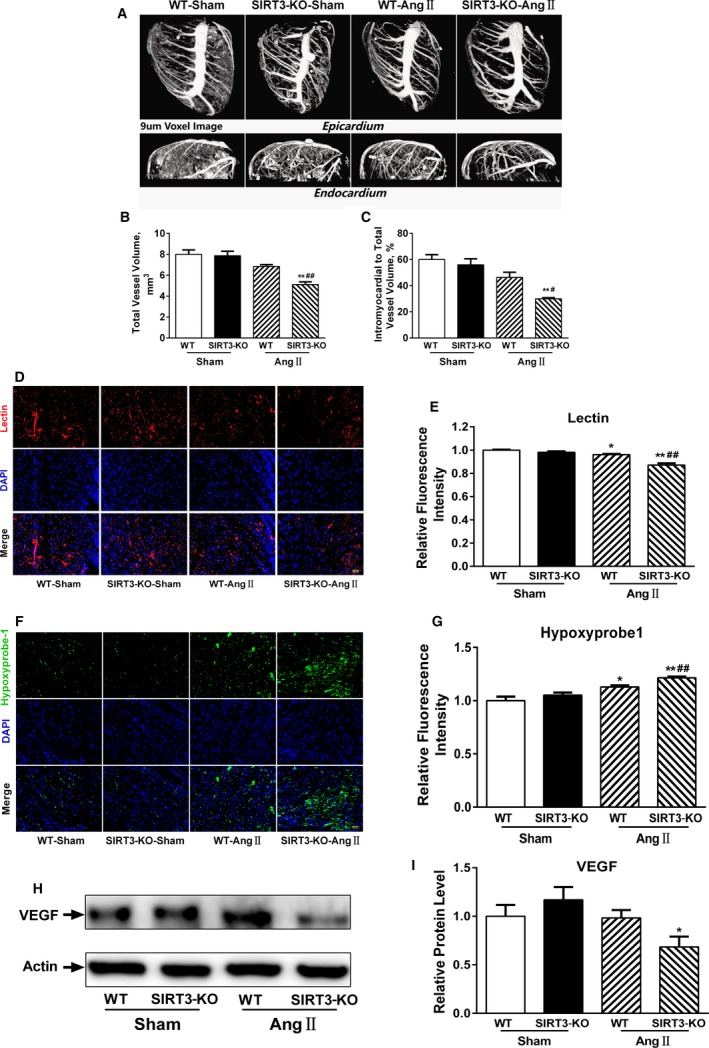
Sirtuin 3 (SIRT3) deficiency exacerbates microvascular rarefaction after angiotensin II (Ang II) challenge. A, Representative micro‐computed tomography images of myocardial vasculatures after Microfil perfusion. B and C, Quantitative assessment of total vessel volume, and intramyocardial vessel volume normalized to total vessel volume (n=3/group). Data are presented as mean±SEM. D, Representative images of cardiac sections stained with lectin (red) and 4’,6‐diamidino‐2‐phenylindole (DAPI; blue). Scale, 200 μm. E, Quantification of lectin intensity. F, Representative images of cardiac sections stained with hypoxyprobe‐1 (green) and DAPI (blue). Scale, 200 μm. G, Quantification of hypoxyprobe‐1 intensity. H through I, Representative vascular endothelial growth factor (VEGF) Western blot and densitometry. Data are relative to that of wild‐type (WT)‐sham mice (mean±SEM). *P<0.05, **P<0.01 vs genotype‐matched sham mice; # P<0.05, ## P<0.01 vs WT‐Ang II mice. KO indicates knockout.