
Figure 6.
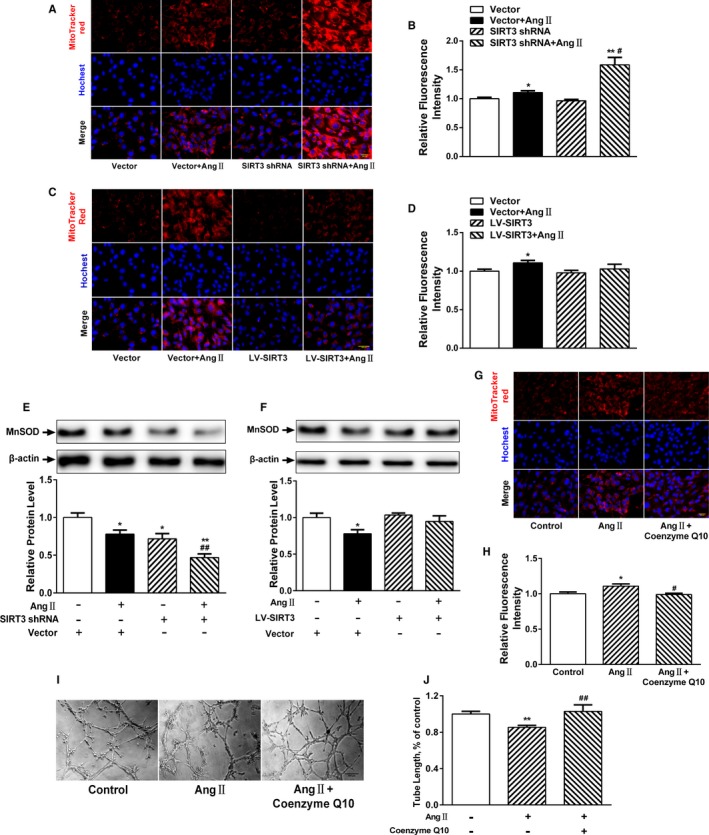
Attenuated mitochondrial oxidative stress restores angiogenic capacity. A, Representative images of reactive oxygen species (ROS) and MitoTracker Red staining in Sirtuin 3 (SIRT3)‐short hairpin RNA (shRNA) or negative control cardiac microvascular endothelial cells (CMVECs). Scale, 200 μm. B, MitoTracker Red quantification. C, Representative images and (D) quantification of ROS with MitoTracker Red staining in lentivirus‐mediated SIRT3 (LV‐SIRT3) or negative control CMVECs. Scale, 200 μm. E, Representative Western blot analysis and quantification of manganese superoxide dismutase (MnSOD) expression in SIRT3‐shRNA or negative control cells. F, Representative Western blot analysis and (H) quantification of MnSOD expression in LV‐SIRT3 or negative control cells. Results are expressed as fold‐change over untreated vector‐infected cells. *P<0.05, **P<0.01 vs untreated vector‐infected cells; # P<0.05, ## P<0.01 vs angiotensin II (Ang II)–treated vector‐infected cells. G, Representative fluorescence images and (H) quantification of ROS with MitoTracker Red staining in CMVECs pretreated with or without coenzyme Q10. Scale, 200 μm. I, Representative tube formation images of CMVECs pretreated with or without coenzyme Q10. J, Quantitative analysis of tube length in each well. Five images per well were randomly chosen to be measured. *P<0.05, **P<0.01 vs control cells; # P<0.05, ## P<0.01 vs Ang II treatment.