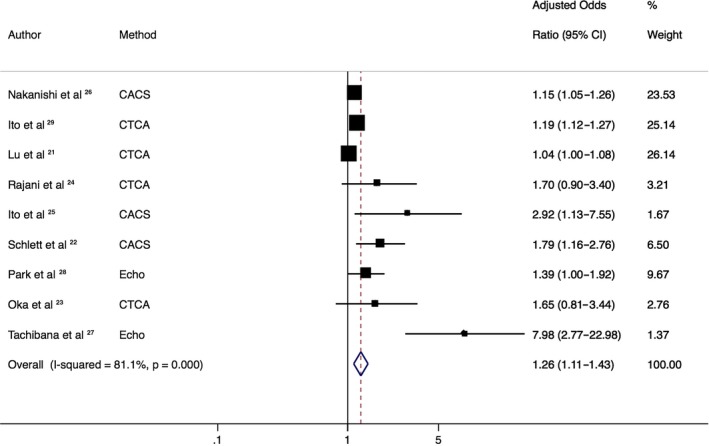
Figure 2.

Association of epicardial adipose tissue (EAT) with presence of high‐risk plaque (HRP). Forest plot displays summary odds ratios and 95% confidence intervals (CIs) for the increasing association of EAT with HRP. Method represents the radiologic method of calculating EAT. This demonstrates a significant association of increasing EAT with HRP. CACS indicates coronary artery calcium score (noncontrast computed tomography); CTCA, computed tomography coronary angiography; Echo, echocardiography.
