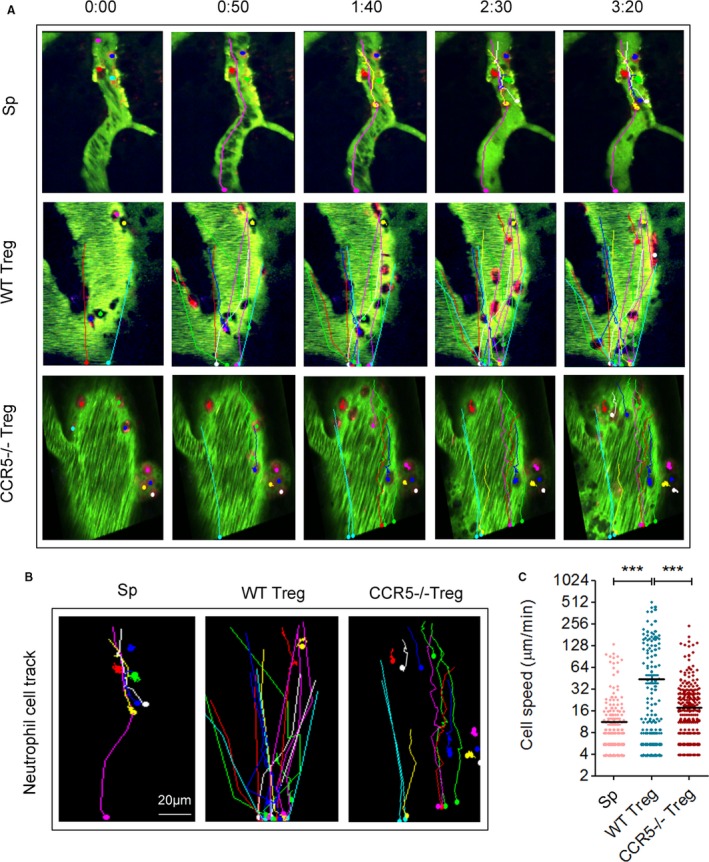
Figure 3.

Neutrophils/macrophages in CCR5−/− Treg‐treated stroke mice slow down in the ischemic areas as compared with those in wild type (WT) Treg‐treated stroke mice. A, Representative 2‐photon time lapse images of splenocyte (Sp), WT Treg, or CCR5−/−Treg‐treated stroke animals. Color lines represent the routes of rhodamine 6G‐labeled neutrophils/macrophages. Images are representative of 3 to 5 animals/group. B, Representative images of neutrophil/macrophage routes after intravenous injection of rhodamine 6G. C, Quantification of the moving speed of neutrophils/macrophages during the 2‐photon imaging period. ***P≤0.001. CCR5 indicates C‐C chemokine receptor type 5; Treg, regulatory T cell.
