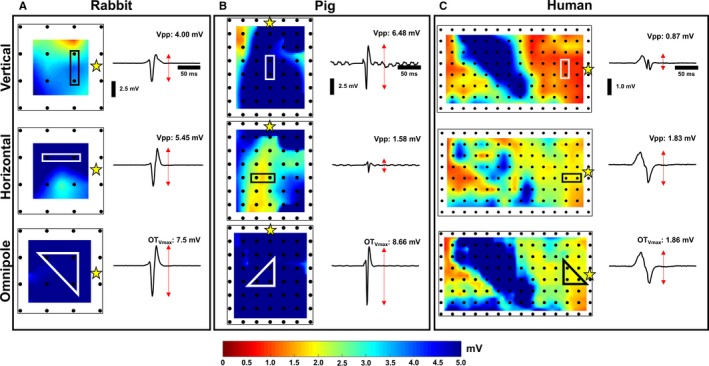
Figure 2.

Bipolar and omnipolar voltage maps. For a single pacing (yellow star) location, bipolar electrograms and voltage maps derived from data collected from 3 arrays from a rabbit heart (A), porcine heart (B), and human heart (C), as shown in the top and middle panels, depict evidence of the bipolar electrogram's dependence on electrode orientation. In contrast, a maximal bipolar electrogram, OT egm, could provide the maximal bipolar voltage, OTV max, within an area and be used to create unambiguous voltage maps. Vpp indicates voltage peak‐to‐peak.
