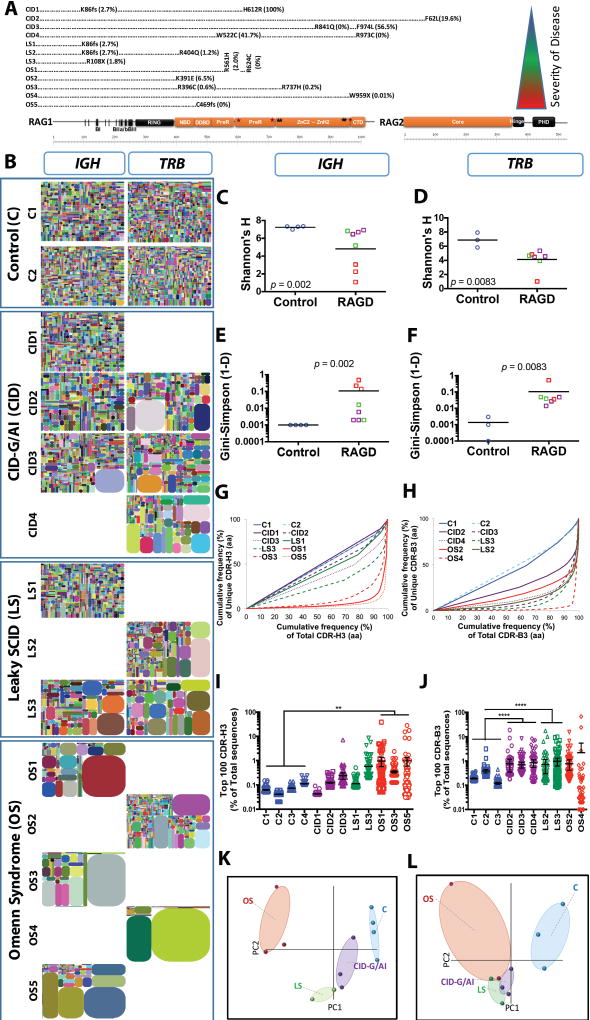
Fig. 1. Progressive IGH and TRB repertoire restriction with increased clonality in the patients with RAG deficiency.
Schematic representation of RAG1 and RAG2 protein with the mutations of the 12 patients according to the severity of clinical presentation from top to bottom (A). Tree maps representing the diversity and clonality of IGH and TRB (B) repertoires from healthy donor controls (representative data from two subjects are presented) and patients with RAG mutations. Each dot represents a unique V to J joining, and the size of the dot represents the relative frequency of that rearrangement in the entire population. No amplification products were obtained for IGH repertoire from patients CID4, LS2, OS2, and OS4, and for TRB repertoire for patients CD1, LS1, OS1, OS3, and OS5. Quantification of the diversity (C, D) and unevenness (E, F) of the IGH (C, E) and TRB (D, F) repertoires using Shannon’s H index of diversity and Gini- Sipmson’s index of unevenness in healthy controls (blue circles), and patients with CID-G/AI (purple boxes), LS (green boxes), and OS (red boxes). The cumulative frequencies of unique versus total CDR3 clonotypes are shown for IGH (G) and TRB (H) repertoires (CDR-H3 and CDR-B3, respectively). Mean values ± SE are shown; t-test was used for statistical analysis. Representation of the frequency of the top 100 most abundant clones for IGH (I) and TRB (J) sequences in RAG-mutated patients and healthy controls (mean ± SE; ANOVA with post hoc test of Dunnett’s multiple comparisons with *** 0.001 < p < 0.01 and * p < 0.05). Sample plots illustrating the segregation of the various patient groups from healthy controls based on primary component (PC) 1 and 2 determined by five variables (RAG recombination activity, Shannon’s H, Gini-Simpson, number of total and unique sequences) for the IGH (K) and TRB (L) repertoires.

