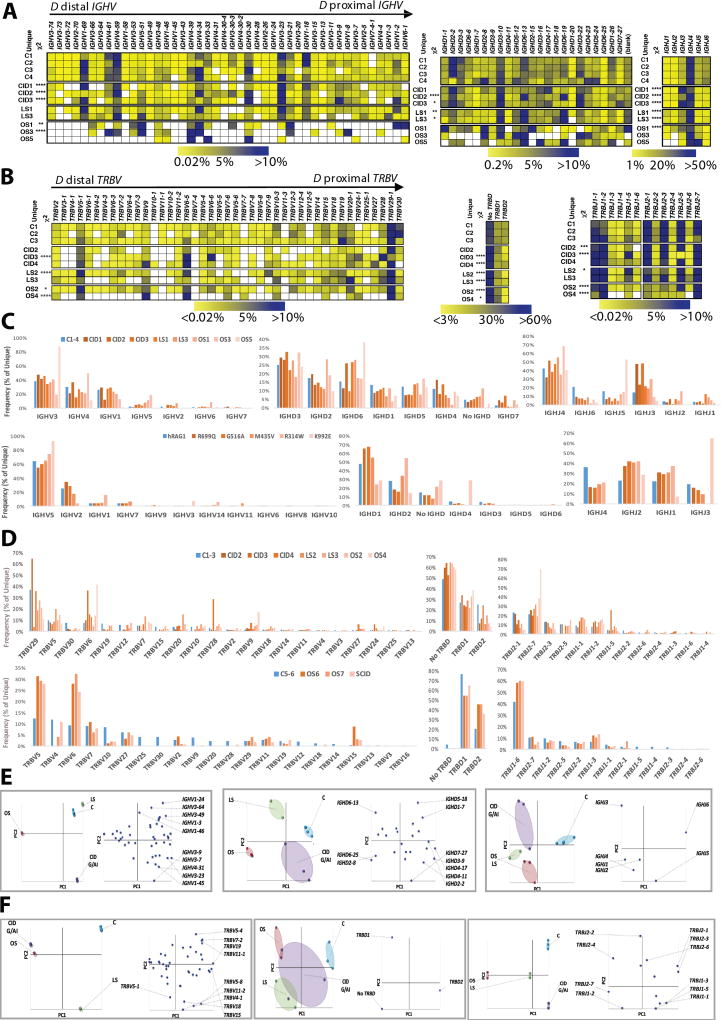
Fig. 2. Differential usage of V, D and J genes in the IGH and TRB repertoires of patients with RAG deficiency.
Heat map representing the frequency of V, D and J gene usage among unique IGH (A) and TRB (B) sequences from healthy controls and RAG-mutated patients. Relative frequency of usage of IGHV and IGHD gene families, and of individual IGHJ genes, in healthy controls and in patients (C, upper panel) and in Abelson virus-transformed pro-B cell lines expressing various RAG1 mutations (C, lower panel). Relative frequency of usage of TRBV gene family and of TRBD and TRBJ genes in healthy controls and in patients (D, upper panel) and in iPS-derived thymocytes (D, lower panel). In panel E, differential usage of IGHV, IGHD and IGHJ genes, segregating control and patient samples and the various genes according to PC1 and PC2 is shown as sample plots (left panels) and variable plots (right panels). In panel F, differential usage of TRBV, TRBD and TRB genes, segregating control and patient samples and the various genes according to PC1 and PC2 is shown as sample plots (left panels) and variable plots (right panels).

