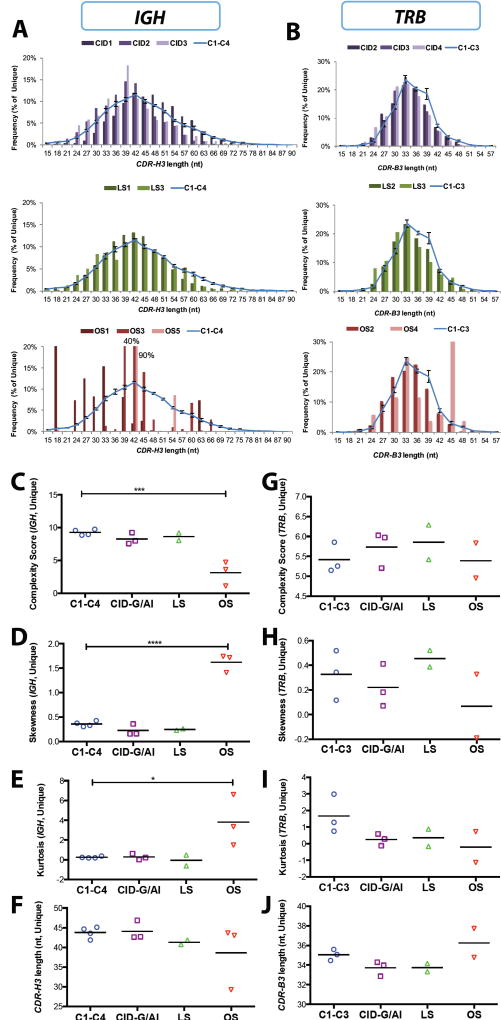
Fig. 3. Characteristics of the CDR3 region of IGH and TRB unique sequences in peripheral blood lymphocytes.
Distribution of the length of the CDR3 region of IGH (CDR-H3) (A) and TRB (CDR-B3) (B) unique sequences from peripheral blood of patients with RAG deficiency and healthy controls (C1-C4; C6-C8). In panels A and B, the distribution of the CDR3 length in healthy controls is depicted as a blue line (representing mean values ± SE). Complexity scores (C, G), skewness (D, H), kurtosis (E, I) and average length in nucleotides (nt) (F, J) of the IGH (C-F) and TRB (G-J) CDR3 unique sequences in patients with RAG deficiency and controls. In panels C-J, for each group, mean values are shown, and statistical significance was assessed by ANOVA.

