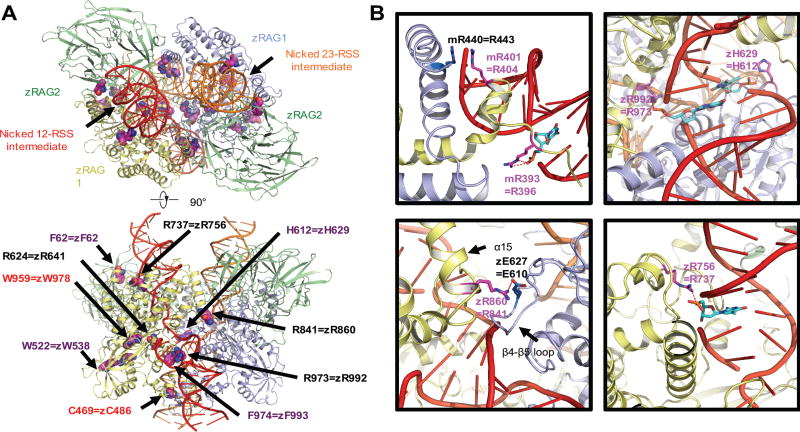
Fig. 6. Mapping the disease-related mutations onto the synaptic-RAG complex models.
Overview of the disease-related mutations shown as space filling models mapped onto the ribbon diagram of the synaptic RAG complex structure (PDB ID 3JBY, top and bottom view) (A). Residues in zebrafish rag1 and rag2 and the equivalent residues that have been mutated in patients are labeled. Only one RAG1-RAG2 subunit is labeled for explicitness on the side view. Labeled in purple and red are residues that are mutated in patients with CID-G/AI and OS, respectively. Residues affected by mutations that correspond to the allele with lower recombination activity in compound heterozygous patients are labeled in black. Examples of the detailed interactions between the equivalent residues from patients and the RSS intermediates or partner residues (PBD ID 3GNA and 3JBY) (B). Equivalent residues that have interaction with RSS intermediates are shown as sticks and highlighted in magenta. The nucleotides in the RSS intermediates that have interaction with protein residues are shown as sticks and highlighted in cyan. The partner residues are shown as sticks and highlighted in marine. Potential interactions are displayed as red dashed lines. z is abbreviated for zebrafish and m is for mouse. All molecular representations were generated in PyMOL (http://www.pymol.org) (47).

