Figure 1.
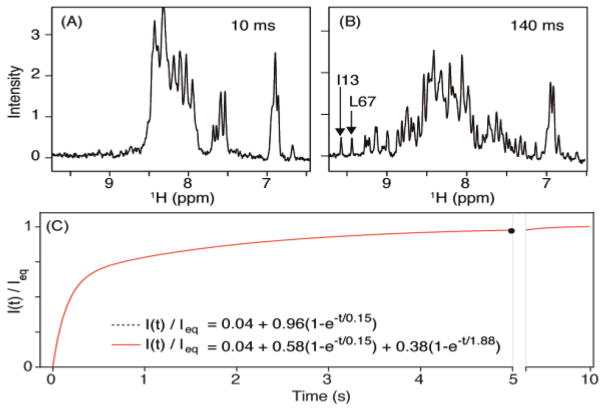
Recovery of the ubiquitin amide signals after dropping the pressure from 2.5 kbar to 1 bar. Sample: 0.3 mM 15N/13C/2H V17A/V26A ubiquitin in 250 μL H2O/D2O (93/7%), 25 mM phosphate buffer, pH 7.5, 295 K (at 1 bar). (A,B) 1D NMR spectra recorded at different times after the pressure drop. A larger set of such spectra is shown in Figure S6. (C) Plot of the ratio of the time-dependent intensity of the two most downfield shifted amides (I13 and L67) over their equilibrium value (measured 10 s after pressure drop). The 0.04 offset in the exponential fits is the fraction of protein, measured in a separate high S/N HSQC spectrum, that remains folded at 2.5 kbar and 298 K.

