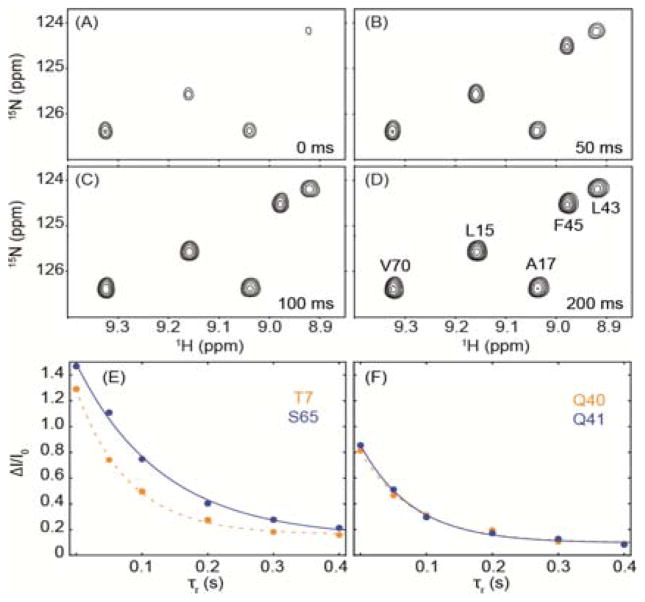
Figure 3.
Refolding time (τr) dependence of NMR intensities. (A–D) Sections of ubiquitin 2D HSQC NMR spectra (with application of the water inversion pulses), measured at various τr values. Sample conditions are as in Figure 1. The sample temperature was set at 298 K during the high pressure (2.5 kbar) period (12 s). Full HSQC spectra are shown in Figure S2. (E,F) Fits of the Sf(τr,Tex) to Ae−τr/τf + B, for T7, S65, Q40, and Q41. A full set of curves is shown in Figure S3.

