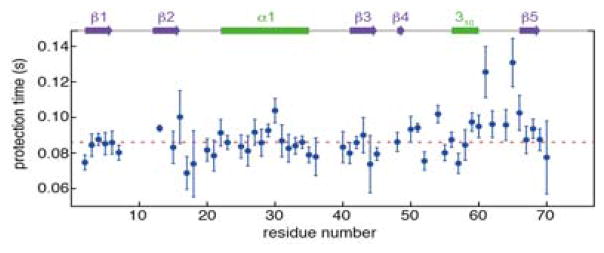
Figure 4.
Protection times, τf = 1/λ, for HX during protein folding. Fitted time constants as a function of residue number in the V17A/V26A ubiquitin mutant at 295 K. Error bars reflect the uncertainty as obtained from the covariance matrix of the fit. A color map of the rates on the ubiquitin ribbon diagram highlights spatial proximity of I61 and S65 (Figure S4).

