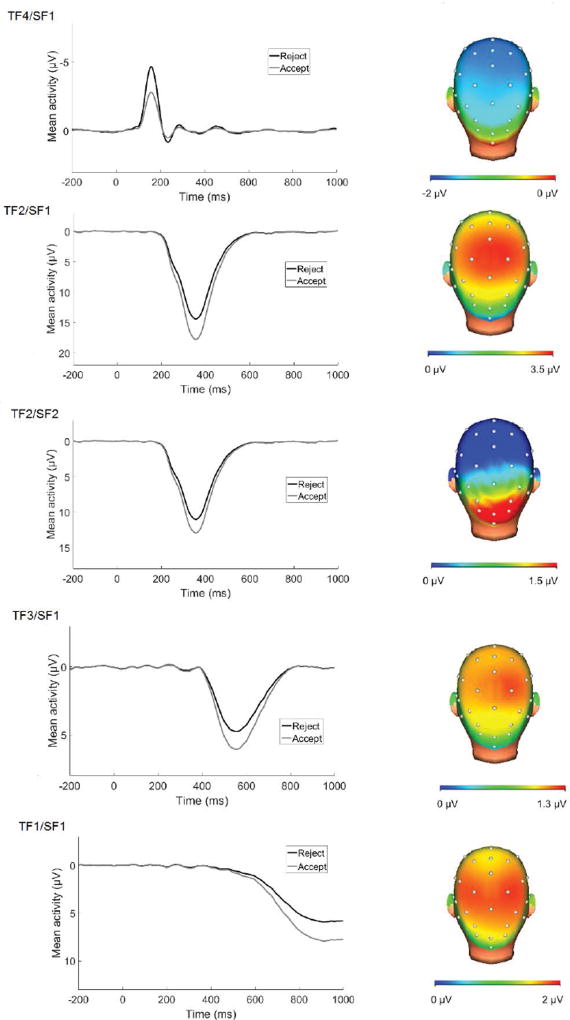
Figure 3.
ERPs and scalp distributions of PCA temporospatial factor combinations accounting for >1% unique variance in the ERP waves and significantly differentiating acceptance from rejection feedback. ERPs are presented at the electrode where each component was maximal (see Table 1). Scalp distributions reflect the relative response to acceptance vs. rejection (i.e., rejection minus acceptance for TF4/SF1 and acceptance minus rejection for remaining components).

