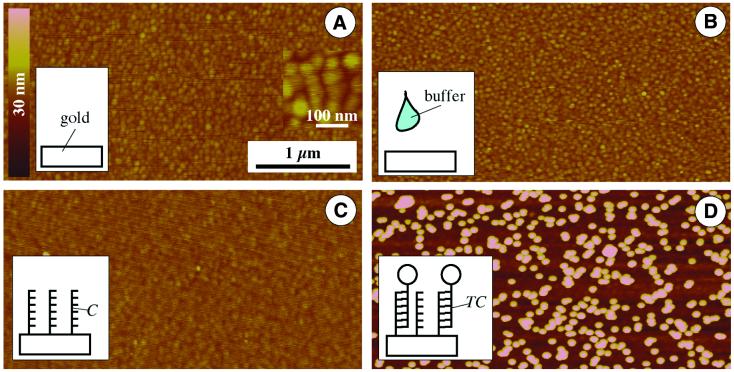
Figure 3.
SFM imaging of the chip surface showing different steps of substrate modification. Height and lateral scale according to the bars in (A). (A) Pure gold substrate. (Inset) Higher magnification revealing the grain size of the sputtered gold. (B) Control, gold substrate incubated with buffer solution without capture DNA. (C) Gold substrate after incubation with capture oligonucleotides, which results in a layer of capture probes. (D) A DNA-modified gold substrate (as shown in C) after incubation with 30 nm gold-labeled target probes.

