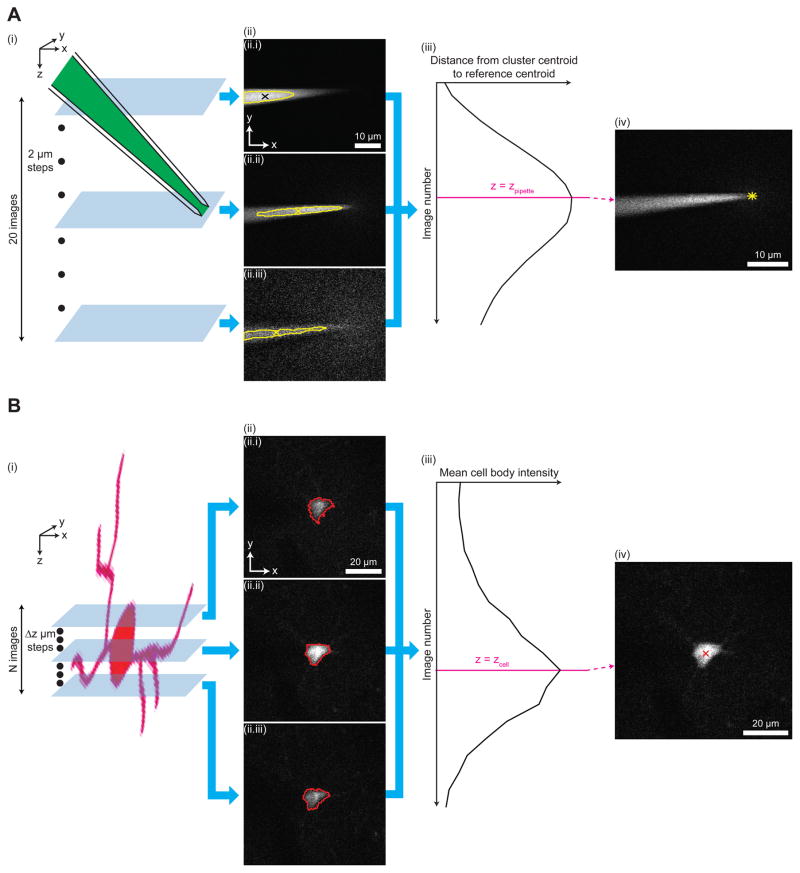
Figure 2. Key algorithms for closed-loop real-time image analysis.
(A) Steps of the pipette tip detection algorithm. (i) A z-stack with 20 images and 2 μm step between consecutive images is acquired around a pipette filled with a dye (e.g., Alexa 488, green). (ii) Each image in the z-stack is analyzed to identify the cluster of bright pixels (area bounded by yellow outline, corresponding to the fluorescence from Alexa 488 inside the pipette) and the centroid of the cluster (x). The centroid in the topmost image of the z-stack ((ii.i), black x) is used as a reference location corresponding to the far end (i.e., end opposite to the pipette tip) of the pipette. Images 1 (ii.i), 10 (ii.ii), and 20 (ii.iii) of the z-stack, numbered from top to bottom, are shown as examples. (iii) The distance between the cluster centroid (x in (ii)) and the reference centroid (black x in (ii.i)) is calculated for each image in the z-stack. The image at which this distance is the largest is identified as the image focused on the pipette tip (magenta line). The z-coordinate of the focused image corresponds to that of the pipette tip (zpipette). (iv) The image focused on the pipette tip is analyzed to yield the location of the pipette tip in the transverse plane (yellow star). For image analysis steps used to locate the pipette tip in the transverse plane, see Figure S3A.
(B) Steps of the cell position detection algorithm. (i) A z-stack is acquired around a tdTomato-expressing cell (red), with N images and Δz step between consecutive images (N = 24, Δz = 3 μm for cell position detection in the brain penetration stage; N = 10, Δz = 2 μm for cell position detection in the closed-loop real-time image-guided pipette positioning stage). (ii) Each image in the z-stack is analyzed to detect the boundary of the cell body (red outline). Images 8 (ii.i), 12 (ii.ii), and 16 (ii.iii) of the z-stack, numbered from top to bottom, are shown as examples. (iii) The mean intensity of pixels representing the cell body (i.e., pixels surrounded by the detected boundary in (ii)) is calculated for each image in the z-stack. The image at which this mean intensity is the highest is identified as the image focused on the centroid of the cell body (magenta line). The z-coordinate of the focused image corresponds to that of the cell centroid (zcell). (iv) The image corresponding to the z-coordinate of the cell centroid is analyzed to yield the centroid position in the transverse plane (red x). For image analysis steps used to detect the boundary and the centroid of the cell body, see Figure S3B.

