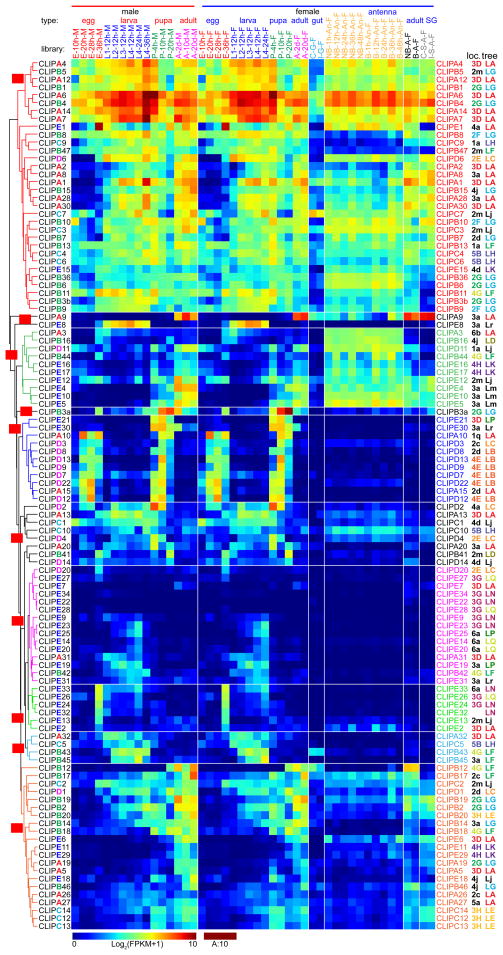
Fig. 4.
Transcript profiles of the 110 CLIPs in A. gambiae. The CLIP mRNA levels in 45 types of the tissue samples, as represented by log2(FPKM+1) values, are shown in the hierarchically clustered gradient heatmap from blue (0) to maroon (10). The values, rounded to the closest integers and, if equal to 10, converted to A, are used to label the color blocks. Subtrees of genes with similar expression patterns are in different colors and assigned with group IDs beginning with C (for CLIP) on red background. The 2nd letter in capital indicates a reliable monophyletic group. Group IDs with the 2nd letter in lowercase are assigned to other branches. The letter A, B, C, D, or E in CLIP gene names are marked on the left with different colors. See Fig. 4 legend for descriptions of library types, chromosomal location IDs, and phylogenetic tree IDs.

