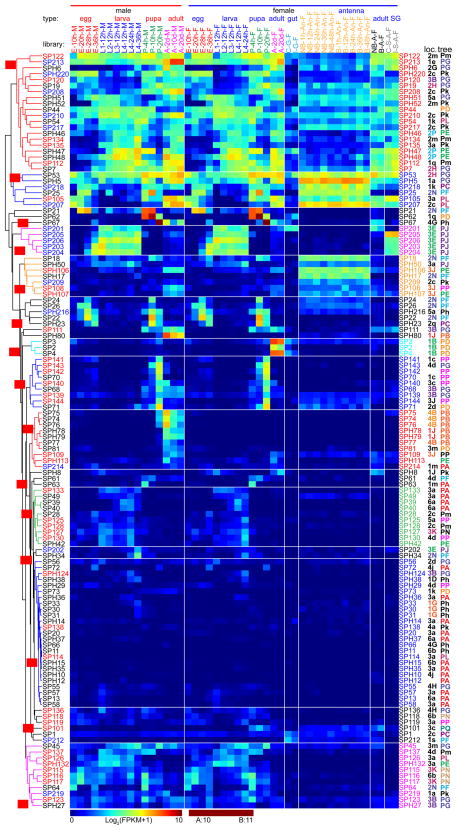
Fig. 6.
Transcript profiles of the 127 SP(H)s in A. gambiae. The serine protease (homolog) mRNA levels in 45 types of tissue samples, as represented by log2(FPKM+1) values, are shown in the hierarchically clustered gradient heatmap from blue (0) to maroon (≥10). The values, rounded to the closest integers and, if equal to 10 and 11, converted to A and B, are used to label the color blocks. Subtrees of genes with similar expression patterns are in different colors and assigned with group IDs beginning with S (for serine in SPs or SPHs) on red background. The 2nd letter in capital indicates a reliable monophyletic group. Group IDs with the 2nd letter in lowercase are assigned to other branches. SP1xx are colored red and SP2xx blue on the left. See Fig. 4 legend for descriptions of library types, chromosomal location IDs, and phylogenetic tree IDs.

