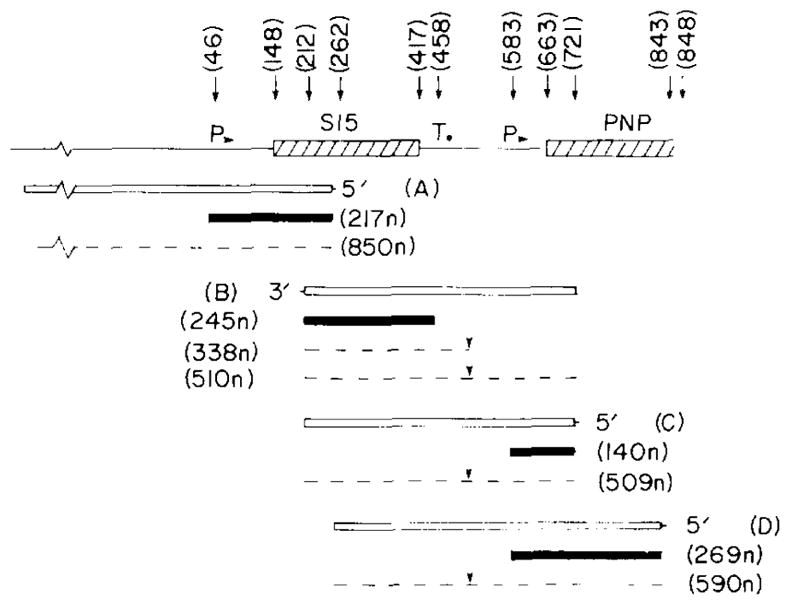
Fig. 4.

The transcription patterns of the rpsO and pnp genes. The results of the S1s nuclease transcript mapping experiments illustrated in Figs. 5,6 and 7 are summarized. At the top the DNA structure is depicted and relevant nt positions are identified. Restriction sites are: HpaII, 212 and 721; PstI, 262; BamHI, 848 (in lacZ). The major promoters (P) and terminators (T) are indicated. The end-labeled DNA probes (open boxes) are: A, 5′ end-labeled 900-bp BamHI-PstI fragment derived from plasmid pUB2; B, 3′ end-labeled 509-bp HpaII fragment from plasmid pHE1; C, 5′ end-labeled 509-bp HpaII fragment, and D, 5′ end-labeled 590-bp PstI-BamHI fragment from plasmid pSH122. Shaded boxes: major protected fragments (sizes in nt); dashed lines: minor protected fragments. Downward arrowheads over the read-through transcripts between rpsO and pnp: possible RNA-processing site.
